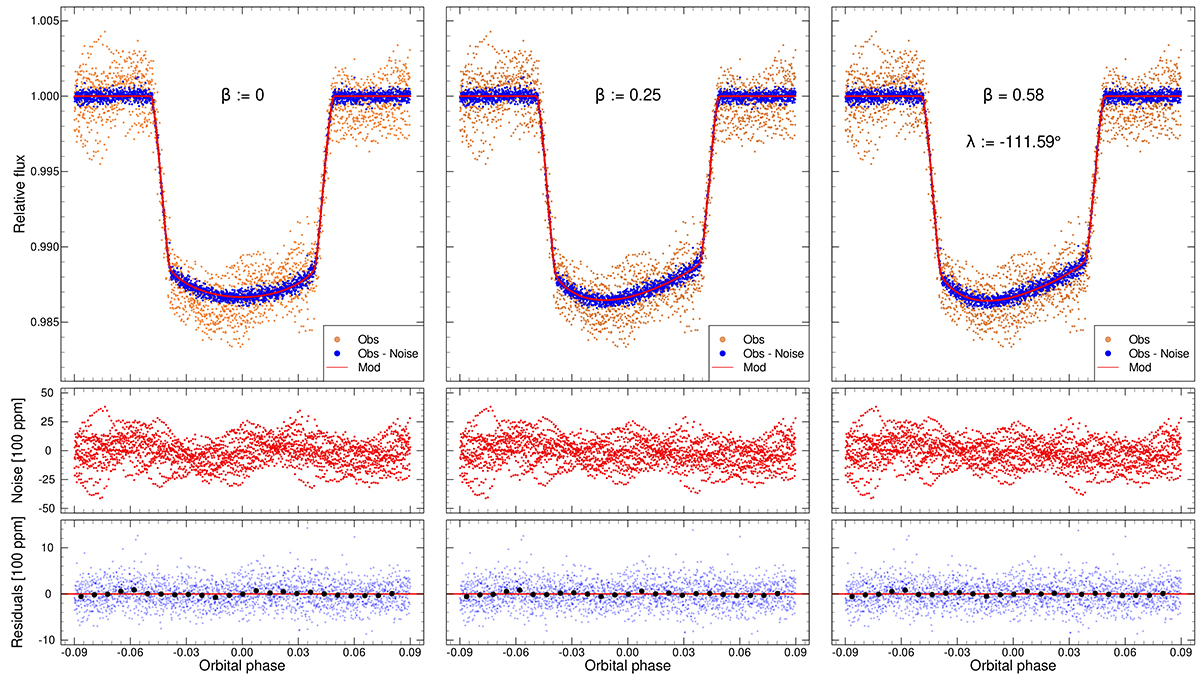
Fig. 1.
Download original image
Resulting light curve solutions for the three considered scenarios: β fixed to 0 (left column), β set to 0.25 (middle column), and λ set to −111.59° (right column). The top panels show the observed light curve (orange dots), the observed light curves with the noise removed (blue dots), and the transit model (solid red line). The fitted correlated noise (see text for details) is shown in the middle row, while the residuals where the noise and the transit model are subtracted from the observations are shown in the bottom row (blue dots), with bins of 100 data points (the error bars for the binned points are not shown as they are too narrow). Due to the nature of our analysis, the observed light curve (orange points, top panel) is decomposed into the transit model (solid red line, top panel), the correlated noise (middle panel), and the white noise (blue dots, bottom panel).
Current usage metrics show cumulative count of Article Views (full-text article views including HTML views, PDF and ePub downloads, according to the available data) and Abstracts Views on Vision4Press platform.
Data correspond to usage on the plateform after 2015. The current usage metrics is available 48-96 hours after online publication and is updated daily on week days.
Initial download of the metrics may take a while.