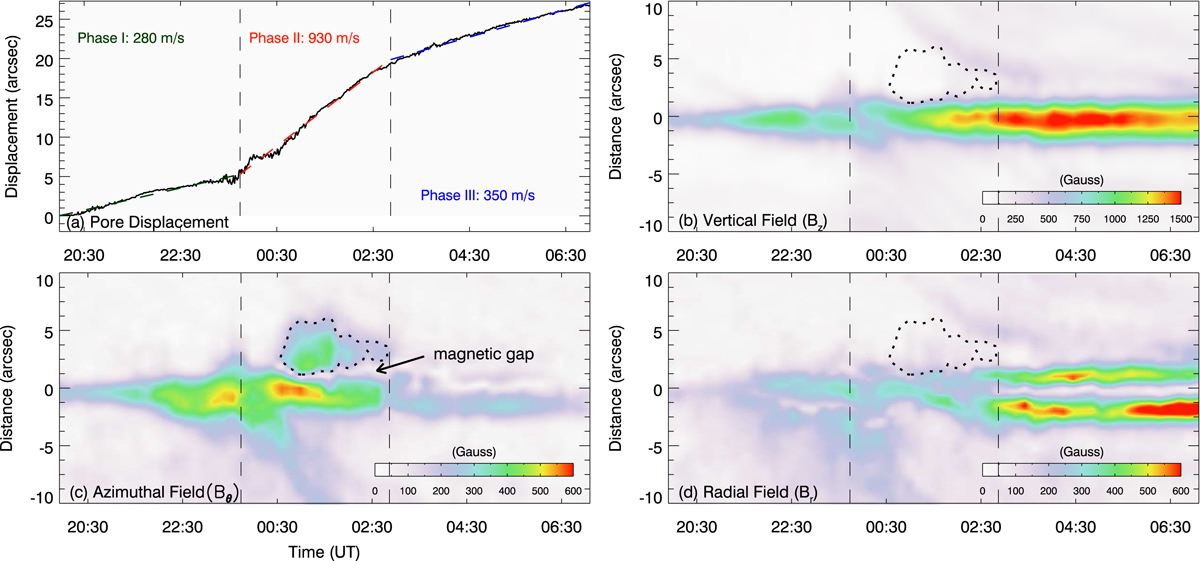
Fig. 5.
Download original image
Time evolutions of the displacement of the pore and the local magnetic field. Panel a: time profile of the displacement of the pore from 20:00 UT of 2012 February 5 to 07:00 UT of 2012 February 6. The vertical dashed line marks two times at 23:45 UT of 2012 February 5 and 02:52 UT of 2012 February 6, which divide the movement of the pore into three phases. The dashed green, red, and blue lines are the linear fits to the displacement of the pore in three phases, respectively. The mean velocity of each phase is calculated as shown by the labels. Panels b–d: time slices of the azimuthally averaged vertical field (Bz), azimuthal field (Bθ), and radial field (Br) in the local frame. The positive and negative directions of the y-axis represents the radial distance in front of and behind the moving pore, respectively. The black arrow in panel c points to the magnetic gap between the between the amplified Bθ outside and the original Bθ within the pore. The black dotted contour overplotted in each panel refers to the boundary of the amplified azimuthal field, with a strength level of 200 G.
Current usage metrics show cumulative count of Article Views (full-text article views including HTML views, PDF and ePub downloads, according to the available data) and Abstracts Views on Vision4Press platform.
Data correspond to usage on the plateform after 2015. The current usage metrics is available 48-96 hours after online publication and is updated daily on week days.
Initial download of the metrics may take a while.