Fig. 4.
Download original image
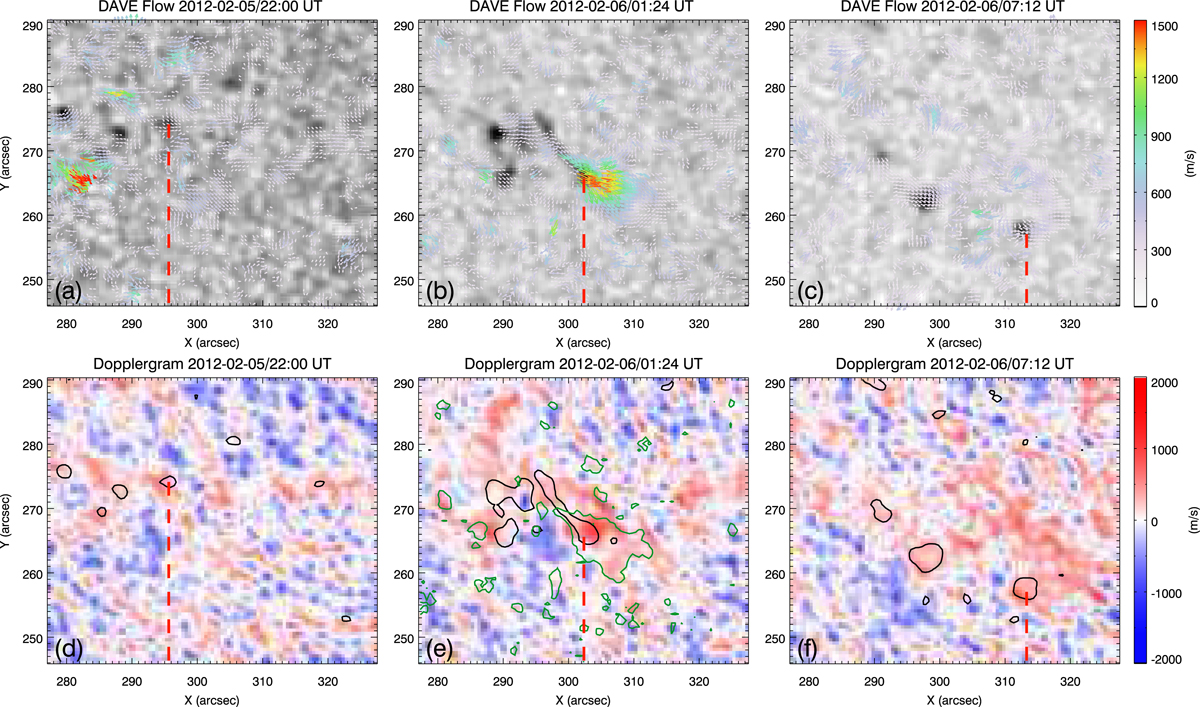
Photospheric horizontal and line-of-sight velocity maps at three selected times corresponding to Fig. 2. Panels a–c: the background greyscale image shows the continuum image, and the overplotted arrows represent the horizontal flow fields (Vx, y) derived by using the DAVE4VM method, with color indicating the velocity. Panels d–f: HMI dopplergrams (Vlos) with the blue and red patches indicate upflows and downflows, respectively. The black contours represent the pore boundaries with intensity level I/IqS = 0.9. The green contours in panel e outlines the region with horizontal velocity greater than 500 ms−1. The vertical red line in each panel marks the X position of the moving pore.
Current usage metrics show cumulative count of Article Views (full-text article views including HTML views, PDF and ePub downloads, according to the available data) and Abstracts Views on Vision4Press platform.
Data correspond to usage on the plateform after 2015. The current usage metrics is available 48-96 hours after online publication and is updated daily on week days.
Initial download of the metrics may take a while.