Fig. 3.
Download original image
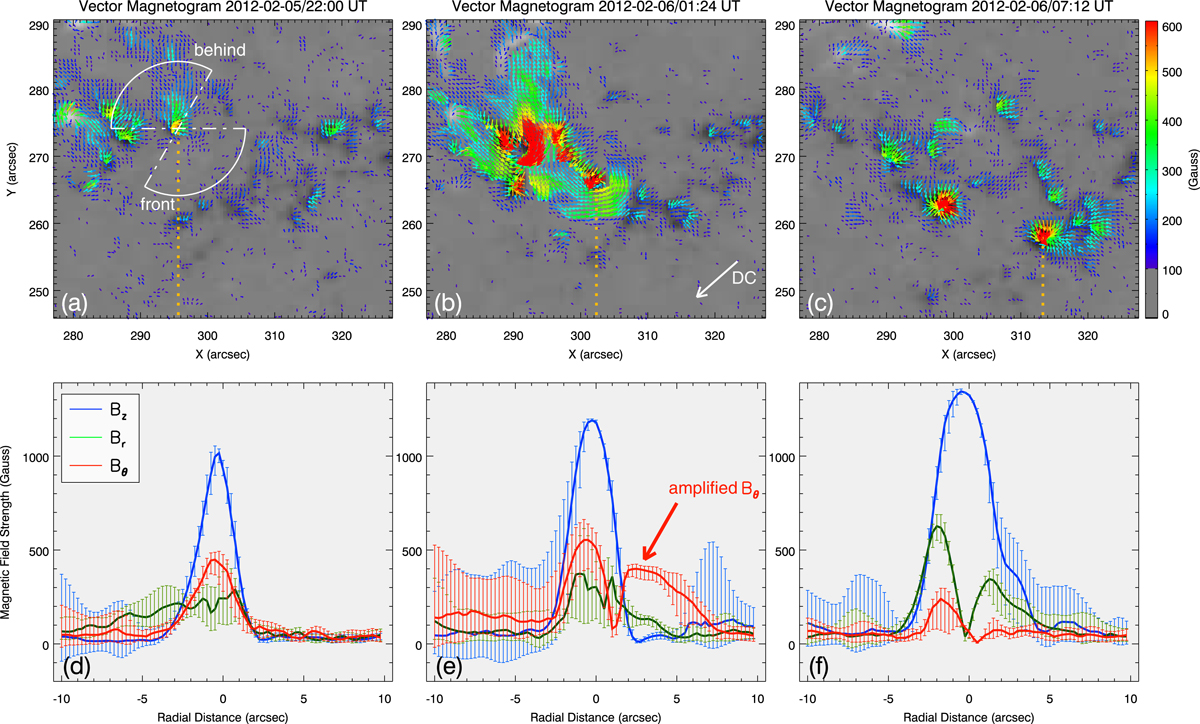
HMI vector magnetograms showing the evolution of HARP 1367 at three selected times corresponding to Fig. 2 shown in panels a–c. The background greyscale image shows the vertical field (Bz), and the overplotted arrows represent the horizontal fields (Bx, y) with color indicating the field strength. The vertical orange line in each panel marks the X position of the moving pore. Panels d–f: magnetic field diagnosis for the local area of moving pore. The horizontal field in the rectangular coordinate (Bx, y) has been transformed into a polar coordinate (Br, θ) with the center of the pore as the origin. The region of interest has been divided into two parts: the area moving frontwards and that moving behind, as illustrated by the two white fan-shaped areas in panela. Azimuthally averaged components of the magnetic field vector (Br, θ, z) are calculated as a function of the radial distance r from the pore center as shown by the colored curves in three panels. The positive and negative directions of the x-axis represents the radial distance in front of and behind the moving pore, respectively.
Current usage metrics show cumulative count of Article Views (full-text article views including HTML views, PDF and ePub downloads, according to the available data) and Abstracts Views on Vision4Press platform.
Data correspond to usage on the plateform after 2015. The current usage metrics is available 48-96 hours after online publication and is updated daily on week days.
Initial download of the metrics may take a while.