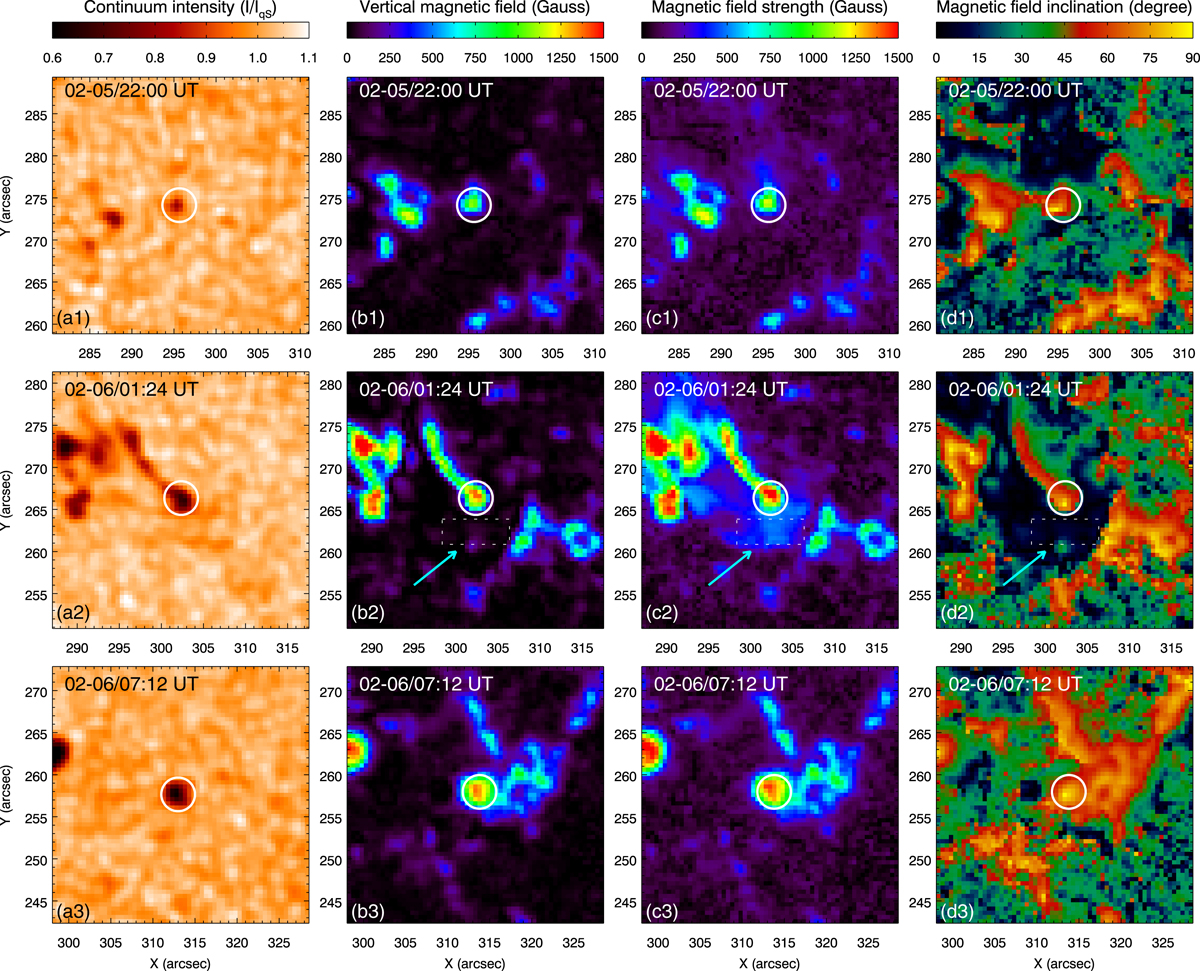
Fig. 2.
Download original image
Maps of continuum intensity (panels a1–a3), vertical magnetic field strength (panels b1–b3), total magnetic field strength (panels c1–c3), and magnetic field inclination (panels d1–d3) at three selected times before, during, and after the rapid movement of the pore (from left to right). The inclination angle is defined as with respect to the photospheric surface, i.e., 0° is horizontal, while that of 90° is vertical. The white circle in each panel marks the position of the moving pore. The cyan arrow in panels b2, c2, and d2 points to the dotted rectangle area in front of the moving pore. The field of view is 30″ × 30″ centered at the target pore.
Current usage metrics show cumulative count of Article Views (full-text article views including HTML views, PDF and ePub downloads, according to the available data) and Abstracts Views on Vision4Press platform.
Data correspond to usage on the plateform after 2015. The current usage metrics is available 48-96 hours after online publication and is updated daily on week days.
Initial download of the metrics may take a while.