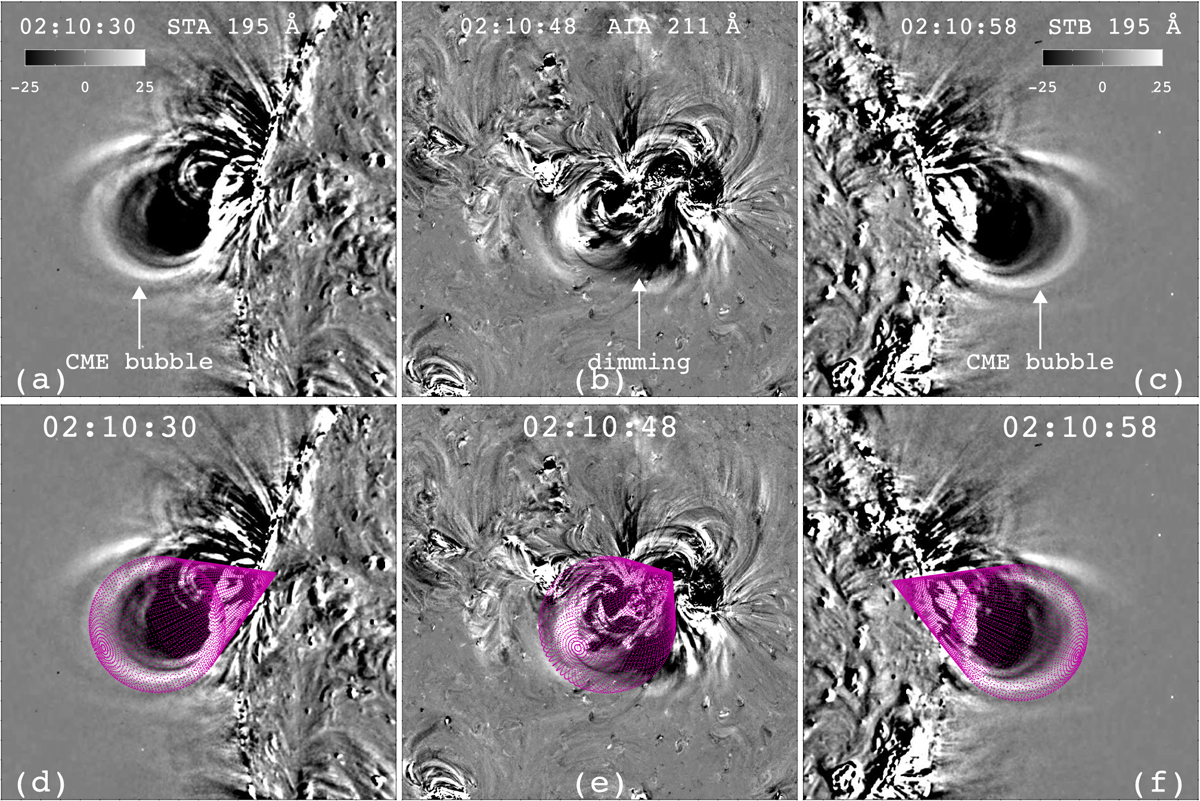
Fig. 5.
Download original image
Top panels: base-difference images in 195 Å observed by STA/EUVI (a) and STB/EUVI (c) at 02:10 UT. Base-difference image in 211 Å observed by SDO/AIA at 02:10 UT (b). The arrows point to the CME bubble and dimming. Bottom panels: same images as the top panels, with the projections of the reconstructed cone being superposed (magenta dots).
Current usage metrics show cumulative count of Article Views (full-text article views including HTML views, PDF and ePub downloads, according to the available data) and Abstracts Views on Vision4Press platform.
Data correspond to usage on the plateform after 2015. The current usage metrics is available 48-96 hours after online publication and is updated daily on week days.
Initial download of the metrics may take a while.