Fig. 4.
Download original image
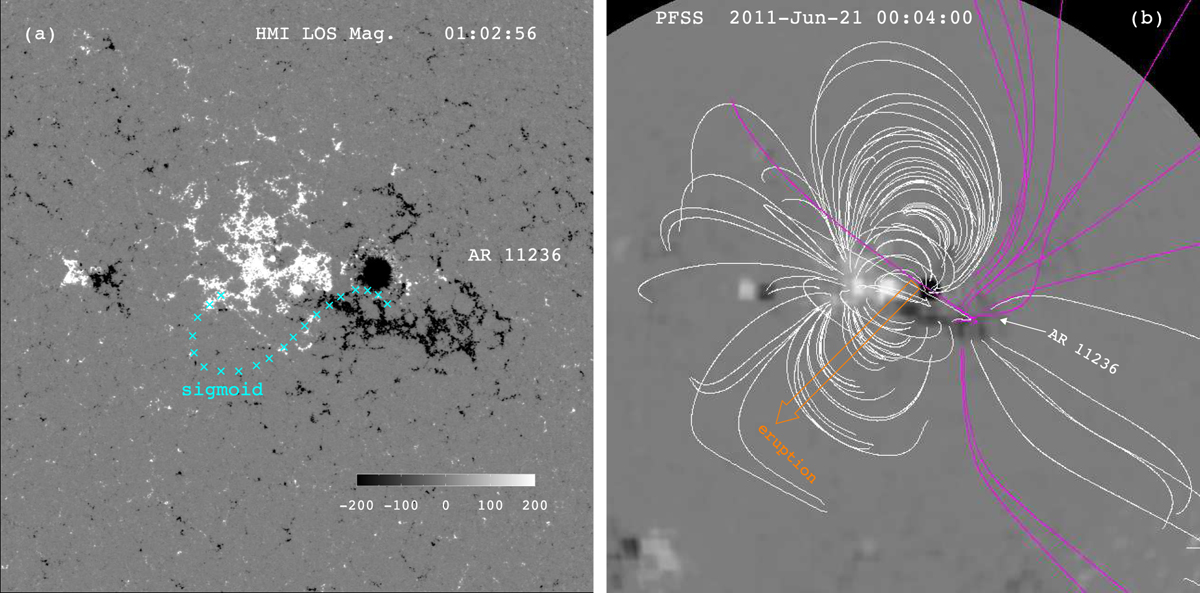
(a) LOS magnetogram of AR 11236 at 01:02:56 UT. The cyan crosses represent the locations of sigmoid in 94 Å. (b) Large-scale 3D magnetic configuration around the AR at 00:04 UT derived from PFSS modeling. The white and magenta lines represent the closed and open field lines. The orange arrow indicates the projected direction of the filament eruption.
Current usage metrics show cumulative count of Article Views (full-text article views including HTML views, PDF and ePub downloads, according to the available data) and Abstracts Views on Vision4Press platform.
Data correspond to usage on the plateform after 2015. The current usage metrics is available 48-96 hours after online publication and is updated daily on week days.
Initial download of the metrics may take a while.