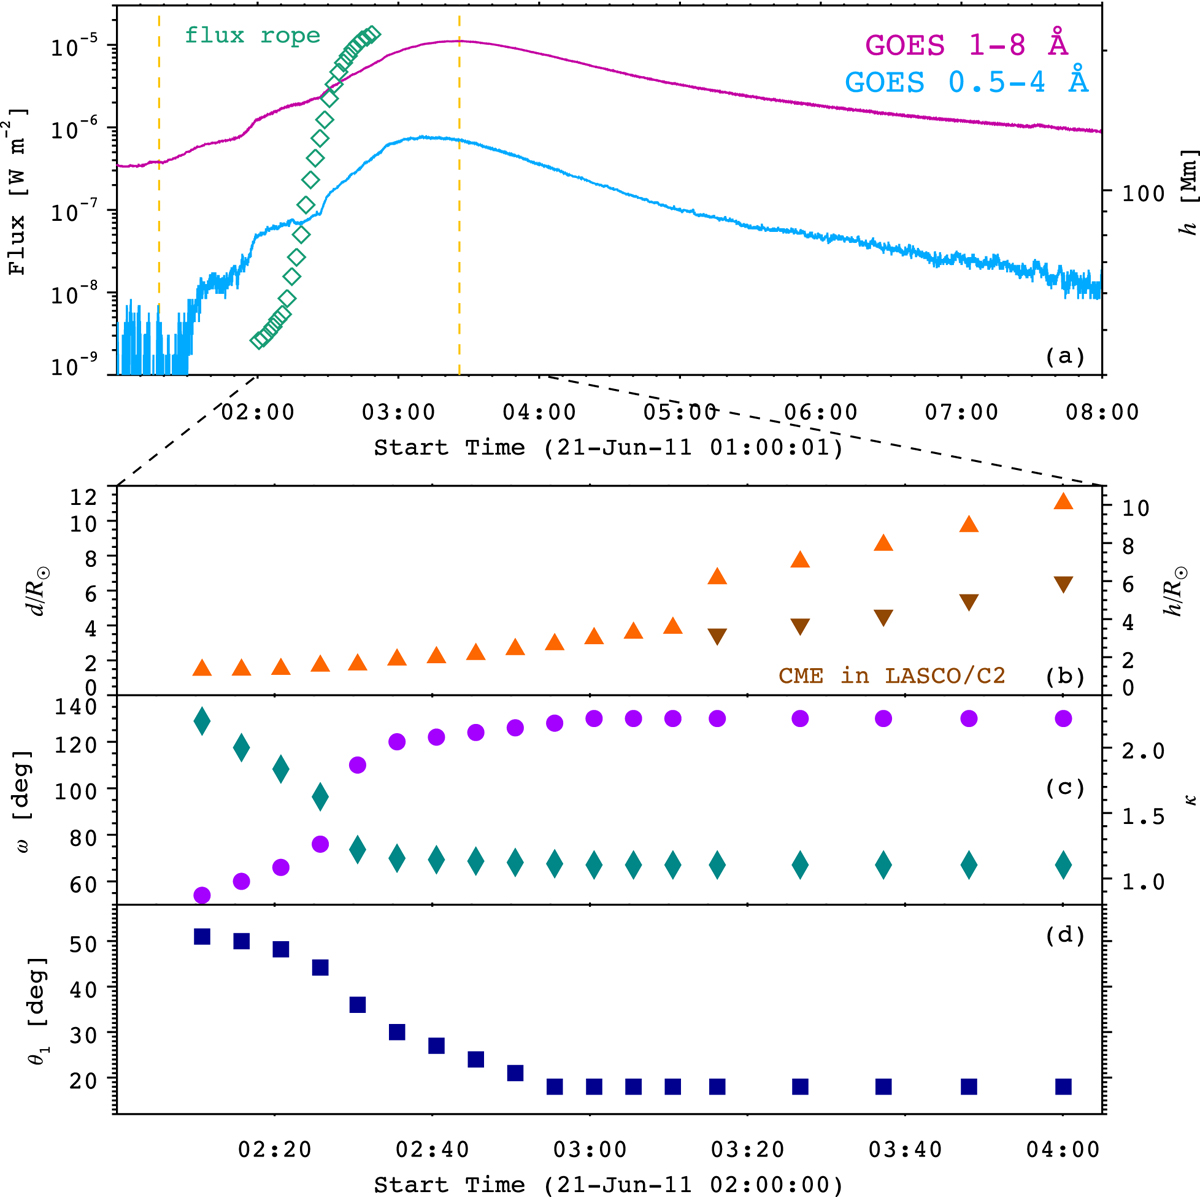
Fig. 2.
Download original image
(a) SXR light curves of the flare in 1–8 Å (magenta line) and 0.5–4 Å (blue line). The yellow dashed lines represent the start (∼01:18 UT) and peak (∼03:26 UT) times of the flare. The green diamonds denote the heights of magnetic flux rope in the MHD simulation (Guo et al. 2021). (b–d) Time evolutions of the real distance (d) of the CME leading edge, angular width (ω), aspect ratio (κ), and inclination angle (θ1) of the cone. Panel b: the heights of the CME in the LASCO/C2 FOV are drawn with brown triangles.
Current usage metrics show cumulative count of Article Views (full-text article views including HTML views, PDF and ePub downloads, according to the available data) and Abstracts Views on Vision4Press platform.
Data correspond to usage on the plateform after 2015. The current usage metrics is available 48-96 hours after online publication and is updated daily on week days.
Initial download of the metrics may take a while.