Fig. 3.
Download original image
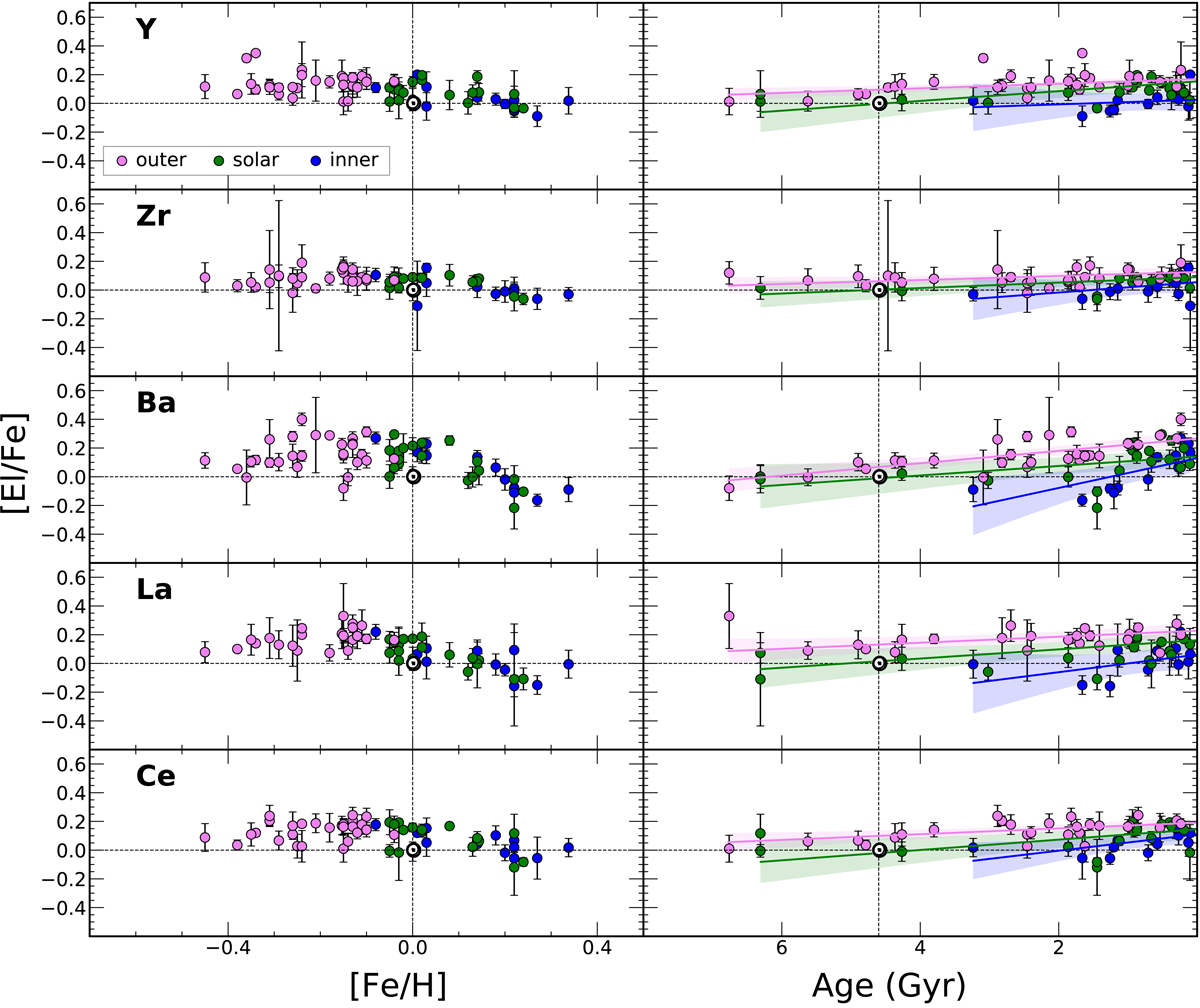
[El/Fe] versus metallicity and age. In the left panels, we show [Fe/H] versus [El/Fe], and in the right panels we show age versus [El/Fe] for our sample of OCs divided into the three galactocentric regions. In blue, we show the OCs located in the inner disc, in green we show those located in the solar neighbourhood, and in pink we show the ones located in the outer disc. In the right panels, the continuous lines are the univariate linear regressions (one for each radial region, colour-coded according to the corresponding sample of OCs), while the shaded regions are their confidence intervals.
Current usage metrics show cumulative count of Article Views (full-text article views including HTML views, PDF and ePub downloads, according to the available data) and Abstracts Views on Vision4Press platform.
Data correspond to usage on the plateform after 2015. The current usage metrics is available 48-96 hours after online publication and is updated daily on week days.
Initial download of the metrics may take a while.