Fig. 6.
Download original image
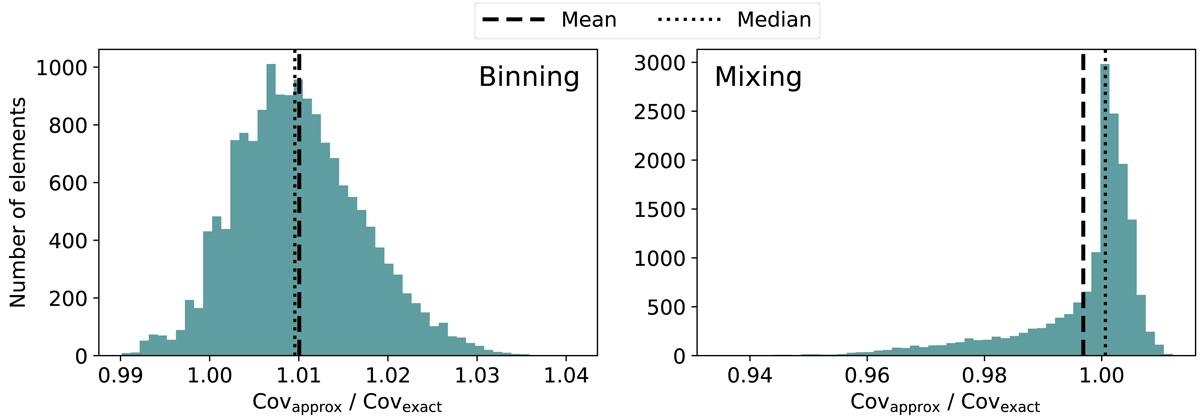
Validation of the connected non-Gaussian approximation used to obtain the mock parameter constraints in Sect. 4.2, which is described in Sect. 4.2.1. Histograms of the ratio of the approximate to exact covariance are shown, for the ‘binning’ (left) and ‘mixing’ (right) steps, for all elements of the bandpower covariance matrix across all redshift bins, measured using the super-sample covariance. The results in all other sections are obtained using the connected non-Gaussian component, calculated in full.
Current usage metrics show cumulative count of Article Views (full-text article views including HTML views, PDF and ePub downloads, according to the available data) and Abstracts Views on Vision4Press platform.
Data correspond to usage on the plateform after 2015. The current usage metrics is available 48-96 hours after online publication and is updated daily on week days.
Initial download of the metrics may take a while.