Free Access
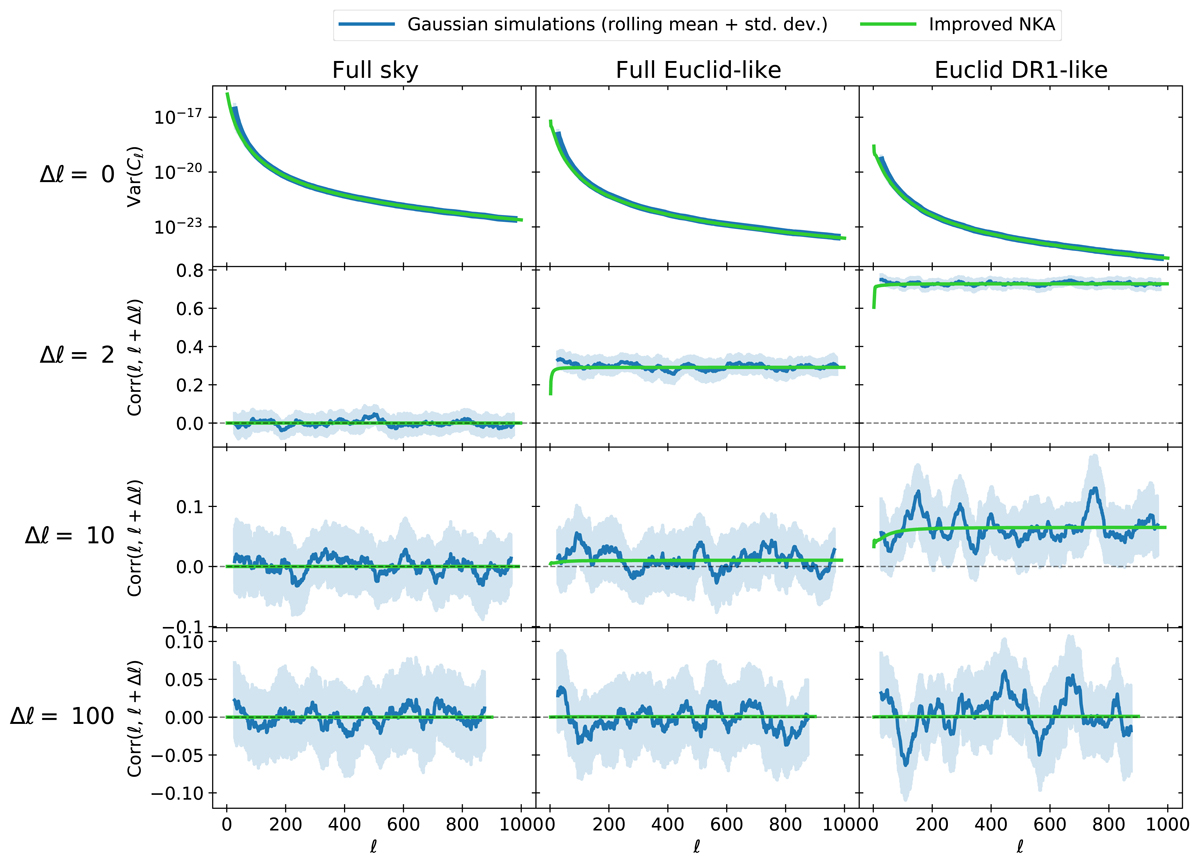
Fig. 4.
Download original image
Comparison between covariance measured from Gaussian field simulations and predicted using the improved NKA method, for the three masks. In all panels the simulated line is a rolling average over 50 ℓs, and the shaded region is the standard deviation over this range. No shape noise is included.
Current usage metrics show cumulative count of Article Views (full-text article views including HTML views, PDF and ePub downloads, according to the available data) and Abstracts Views on Vision4Press platform.
Data correspond to usage on the plateform after 2015. The current usage metrics is available 48-96 hours after online publication and is updated daily on week days.
Initial download of the metrics may take a while.