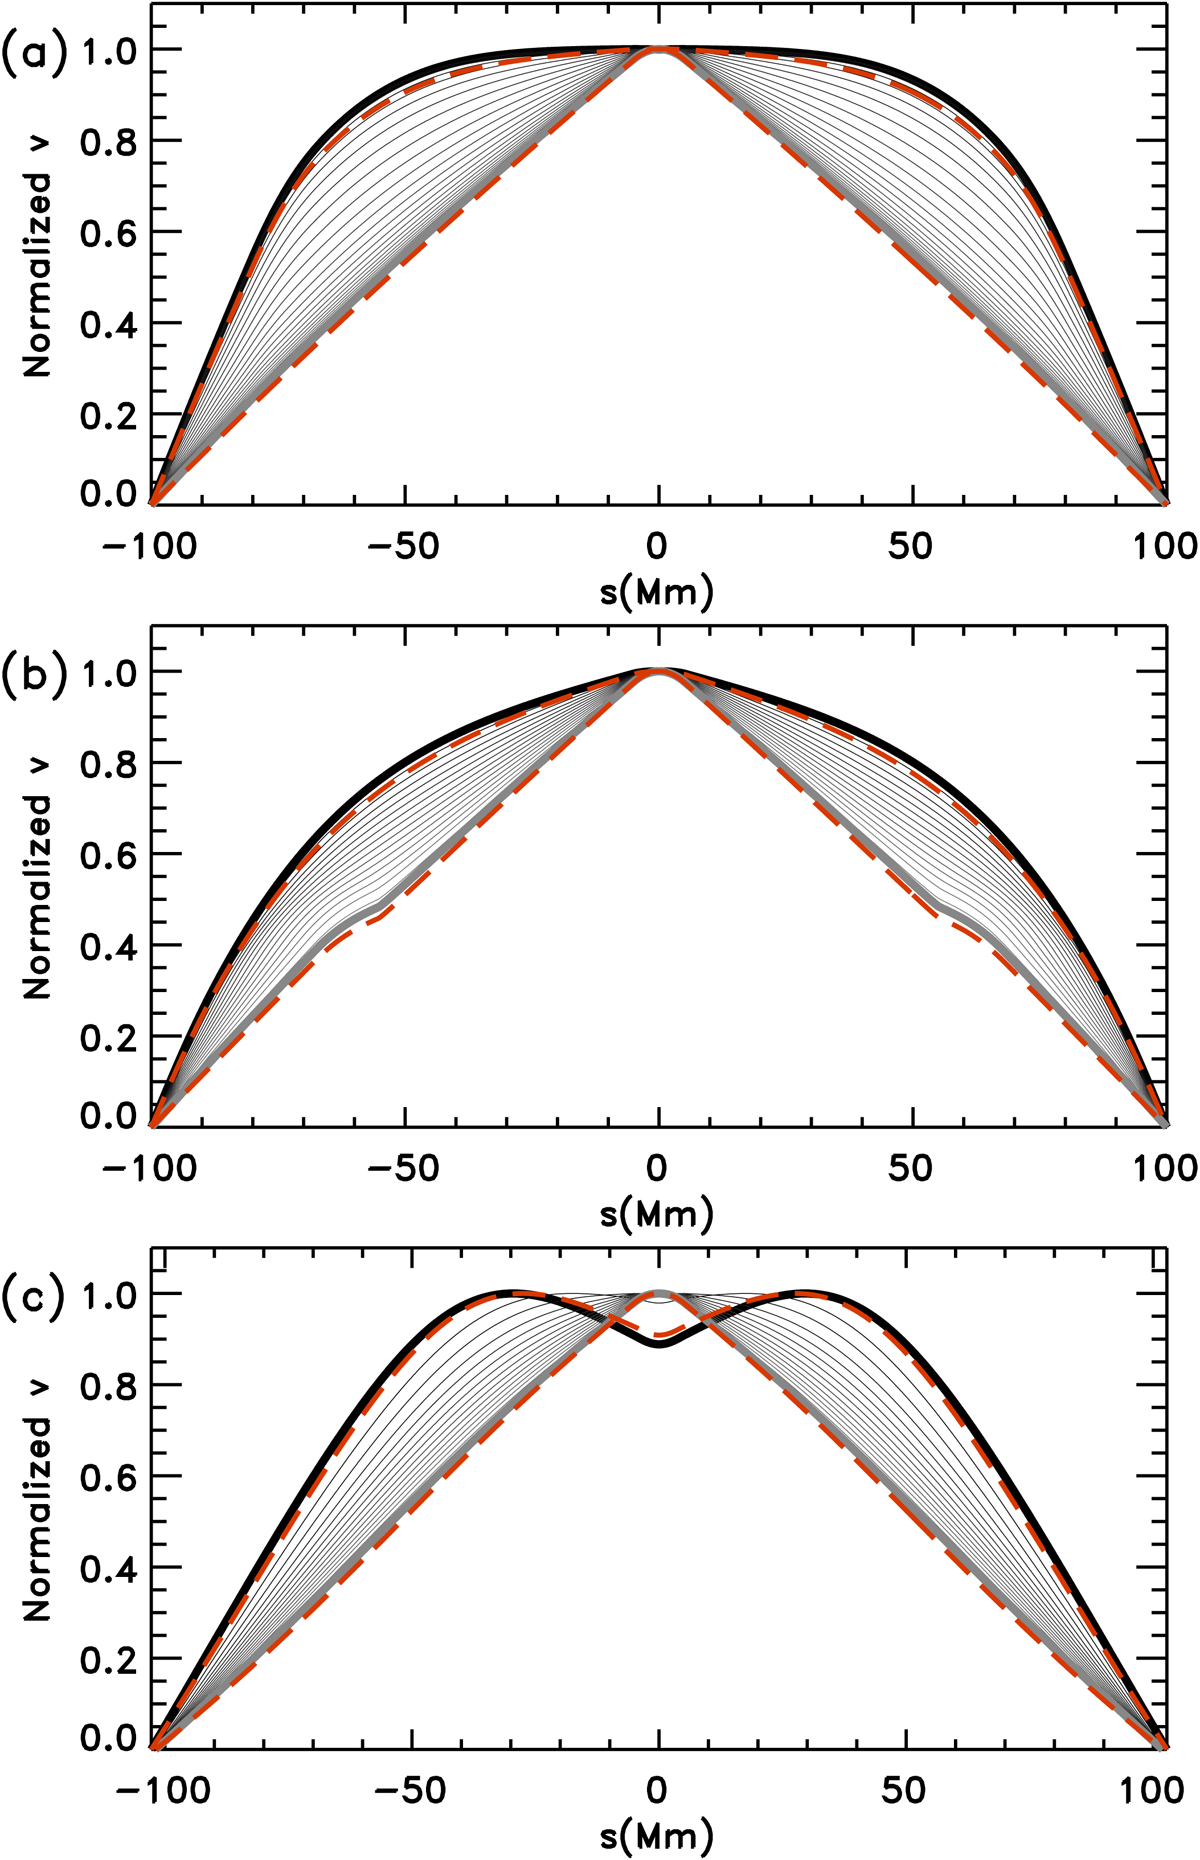
Fig. 6.
Download original image
Eigenfunction v = v(s) solutions of Eq. (4) normalised to its maximum value for (a) circular, (b) elliptical, and (c) sinusoidal tube models (see Fig. 1). The thick black line corresponds to the mode with the minimum radius of curvature for each model (see Sect. 2.3), and the thick gray line corresponds to R0 = 1000 Mm. The thin lines correspond to eigenfunctions with intermediate R0 values, smoothly transitioning between both extreme functions. The two red dashed lines in (a) are the normal modes for both maxima and minima of R0 for the uniform-gravity case.
Current usage metrics show cumulative count of Article Views (full-text article views including HTML views, PDF and ePub downloads, according to the available data) and Abstracts Views on Vision4Press platform.
Data correspond to usage on the plateform after 2015. The current usage metrics is available 48-96 hours after online publication and is updated daily on week days.
Initial download of the metrics may take a while.