Fig. 5.
Download original image
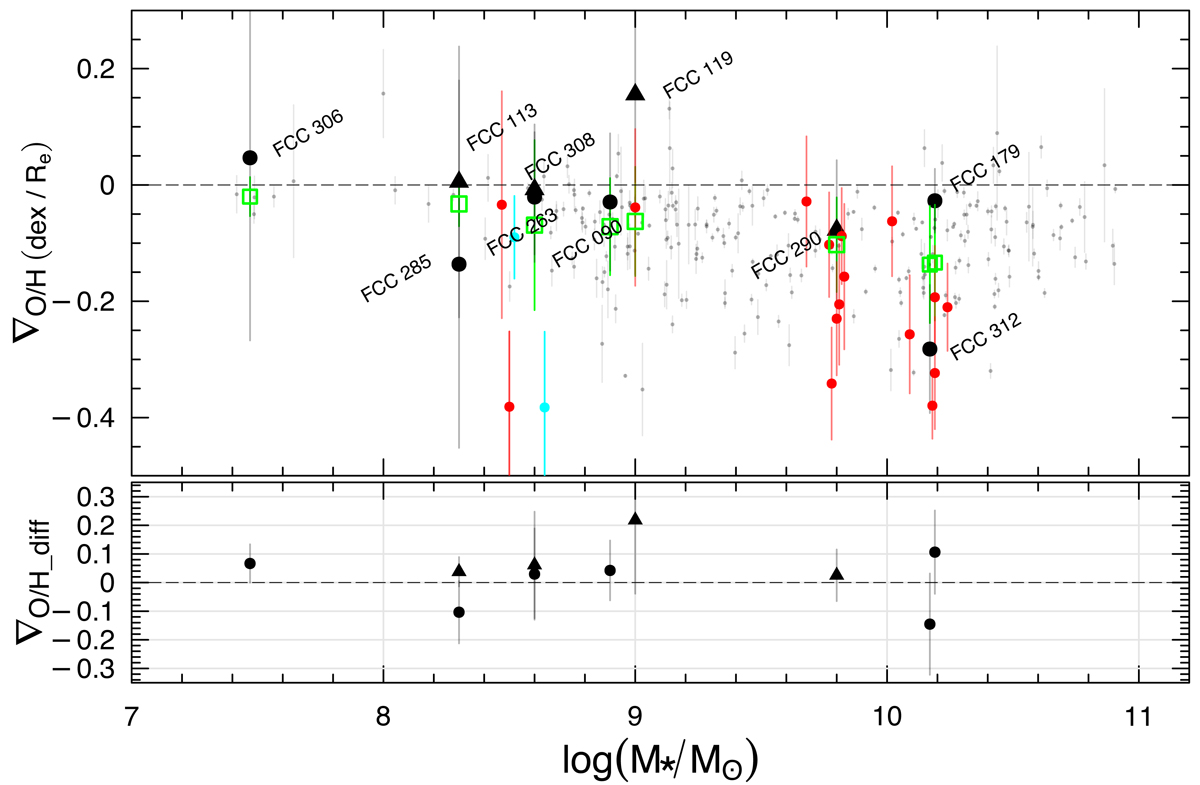
Gas metallicity gradients as a function of stellar mass. The black symbols show our Fornax ELGs sample, with circles and triangles corresponding to recent and intermediate infallers, respectively. The red symbols correspond to galaxies from the MAD survey. The small gray circles indicate galaxies from the SAMI survey. The cyan circles are galaxies from B19. For galaxies from Fornax, MAD, and B19, the vertical bars correspond to the RMSE. For SAMI galaxies, the bars indicate the 1σ error in the metallicity gradient. The green squares show the median values of ![]() and their 1σ dispersion for the control sample (MAD, SAMI and Bresolin et al.) around the stellar mass of each Fornax galaxy; see text for details. Bottom panel: difference in metallicity gradient between each Fornax galaxy and the corresponding value
and their 1σ dispersion for the control sample (MAD, SAMI and Bresolin et al.) around the stellar mass of each Fornax galaxy; see text for details. Bottom panel: difference in metallicity gradient between each Fornax galaxy and the corresponding value ![]() from the control sample.
from the control sample.
Current usage metrics show cumulative count of Article Views (full-text article views including HTML views, PDF and ePub downloads, according to the available data) and Abstracts Views on Vision4Press platform.
Data correspond to usage on the plateform after 2015. The current usage metrics is available 48-96 hours after online publication and is updated daily on week days.
Initial download of the metrics may take a while.