Fig. 4.
Download original image
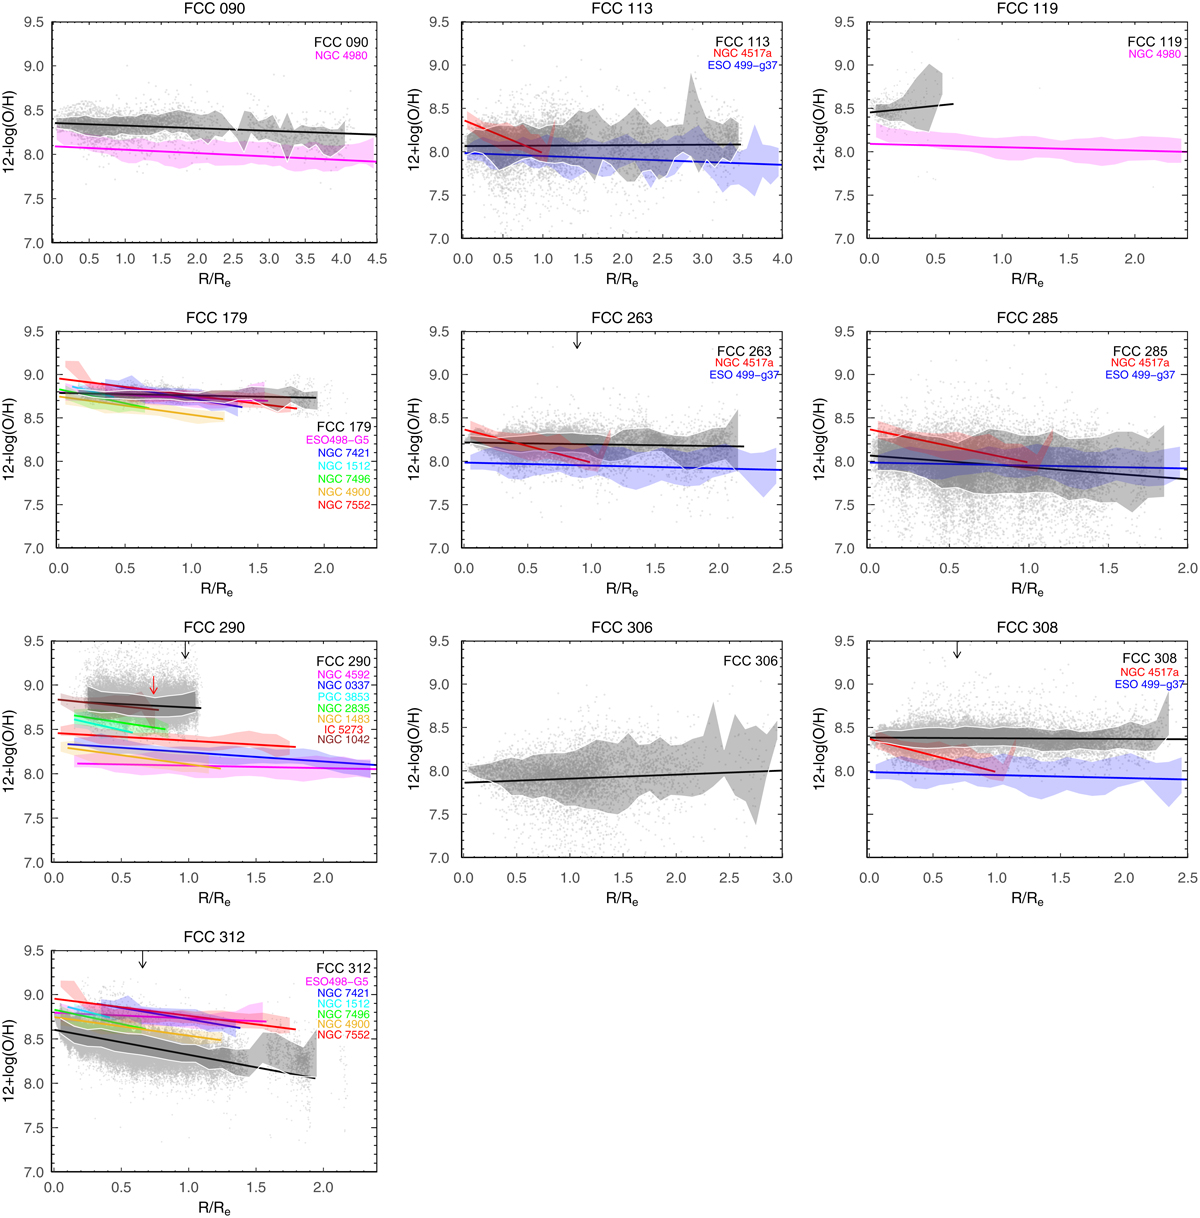
Gas metallicity radial profiles for our sample of Fornax ELGs. Each panel corresponds to a Fornax galaxy (gray dots) and its corresponding control sample from the MAD survey (color dots). The shaded areas around each gradient correspond to the 1σ dispersion in 0.2 dex of R/Re. The gradients of the control samples are colored according to the names inside each panel. The black vertical arrow in the panels of FCC 263, FCC 290, FCC 308, and FCC 312 shows the break radius from Raj et al. (2019). The red arrow in the panel of FCC 290 shows the drop in H2-to-dust ratio from Zabel et al. (2021).
Current usage metrics show cumulative count of Article Views (full-text article views including HTML views, PDF and ePub downloads, according to the available data) and Abstracts Views on Vision4Press platform.
Data correspond to usage on the plateform after 2015. The current usage metrics is available 48-96 hours after online publication and is updated daily on week days.
Initial download of the metrics may take a while.