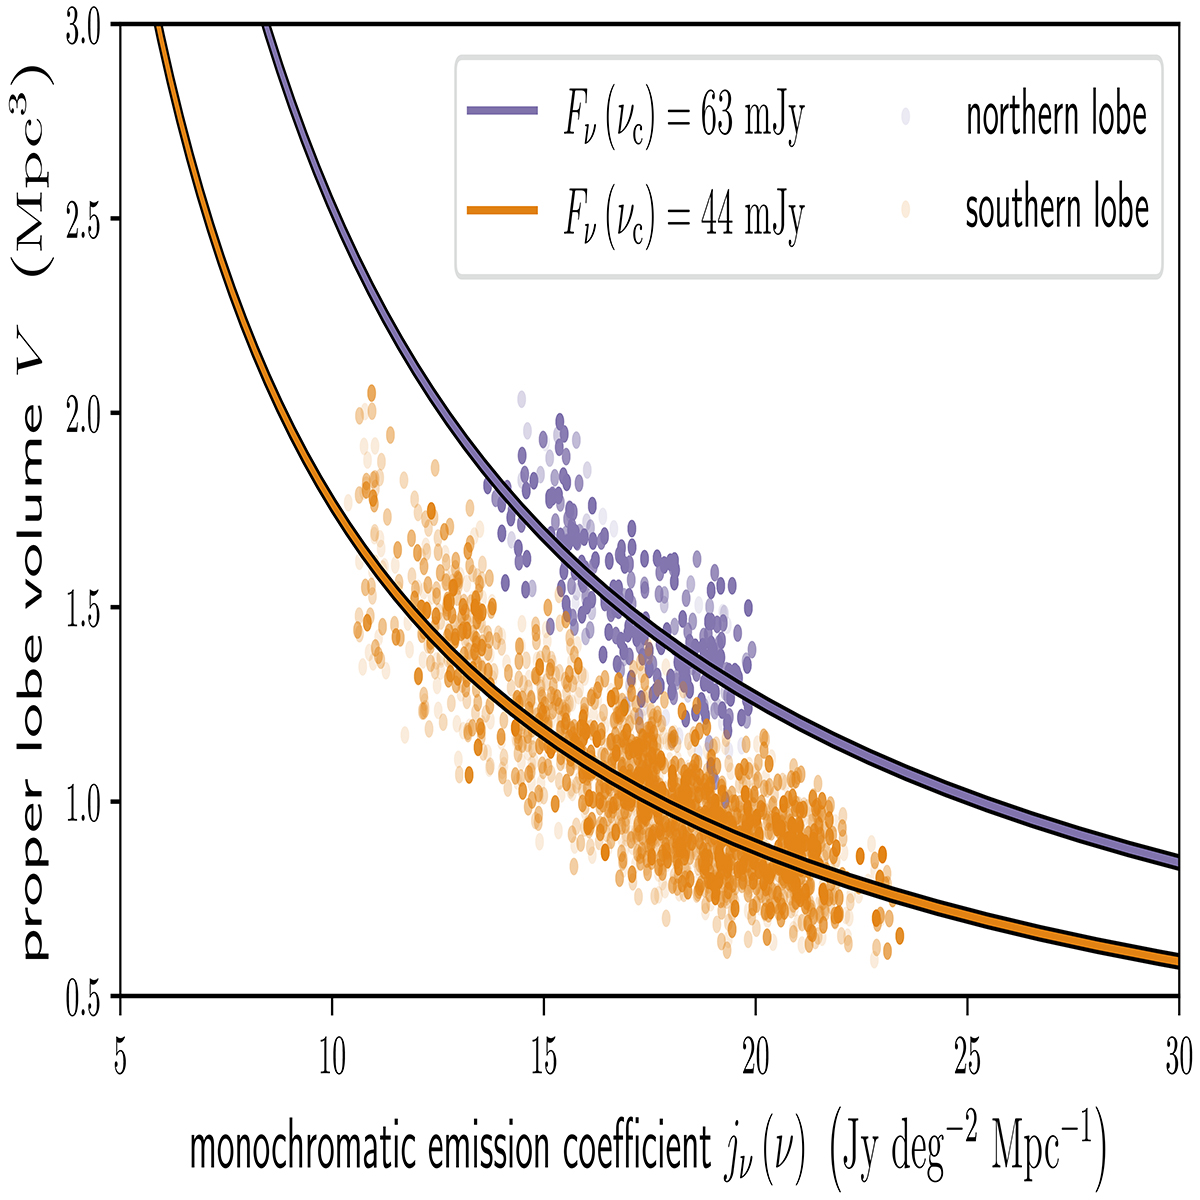
Fig. C.2.
Download original image
Strongly correlated estimates of jν(ν) and V from our Bayesian model, demonstrating consistency with the observed lobe flux densities. We show MECs jν(ν) at ν = 180 MHz and proper volumes V of MH MCMC samples for the northern lobe (purple dots) and southern lobe (orange dots). The curves represent all combinations (jν(ν),V) that correspond to a particular flux density at the LoTSS central wavelength νc = 144 MHz. We show the observed northern lobe flux density (purple curve) and the observed southern lobe flux density (orange curve).
Current usage metrics show cumulative count of Article Views (full-text article views including HTML views, PDF and ePub downloads, according to the available data) and Abstracts Views on Vision4Press platform.
Data correspond to usage on the plateform after 2015. The current usage metrics is available 48-96 hours after online publication and is updated daily on week days.
Initial download of the metrics may take a while.