Fig. 5.
Download original image
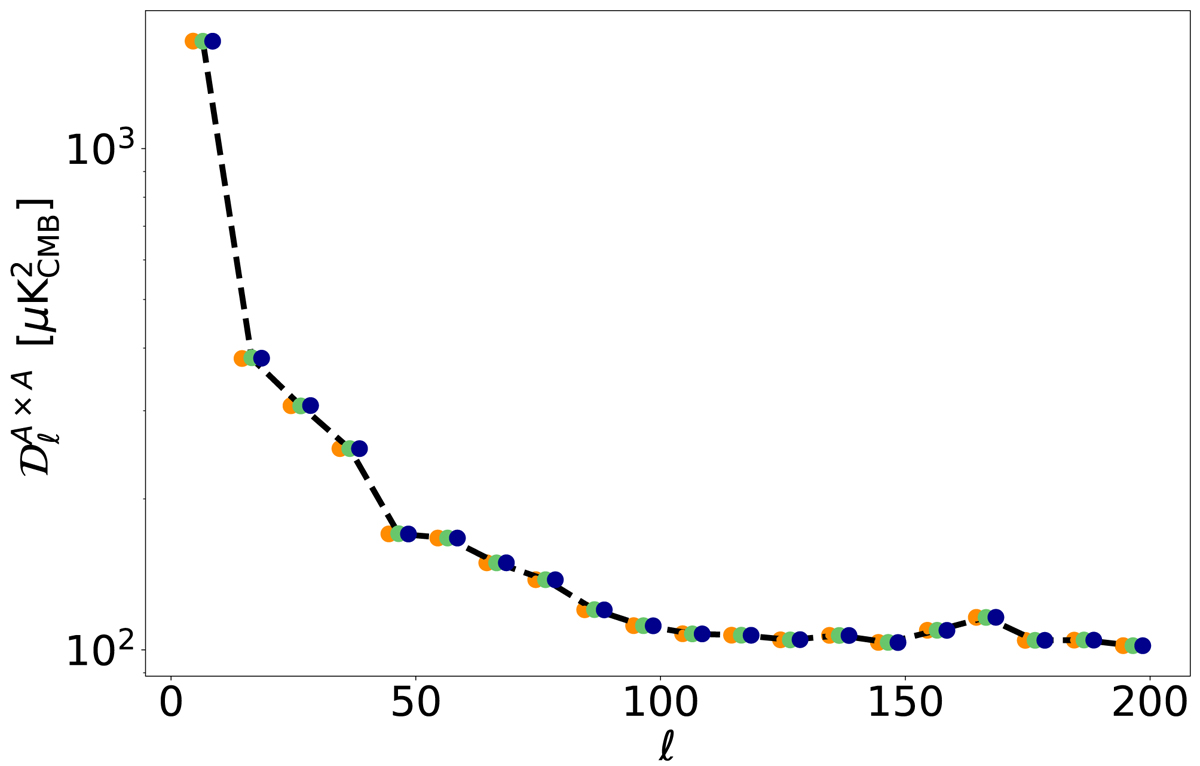
Median of the best-fit values of ![]() for d0 (orange), d1T (green), and d1 (blue) using the MBB fitting scheme. The values for the three simulation types are shifted with respect to one another by ℓ = 2 in order to distinguish them. The black dashed line is the amplitude power spectrum of the dust template map used to build the three simulation sets d0, d1T, and d1.
for d0 (orange), d1T (green), and d1 (blue) using the MBB fitting scheme. The values for the three simulation types are shifted with respect to one another by ℓ = 2 in order to distinguish them. The black dashed line is the amplitude power spectrum of the dust template map used to build the three simulation sets d0, d1T, and d1.
Current usage metrics show cumulative count of Article Views (full-text article views including HTML views, PDF and ePub downloads, according to the available data) and Abstracts Views on Vision4Press platform.
Data correspond to usage on the plateform after 2015. The current usage metrics is available 48-96 hours after online publication and is updated daily on week days.
Initial download of the metrics may take a while.