Fig. 1.
Download original image
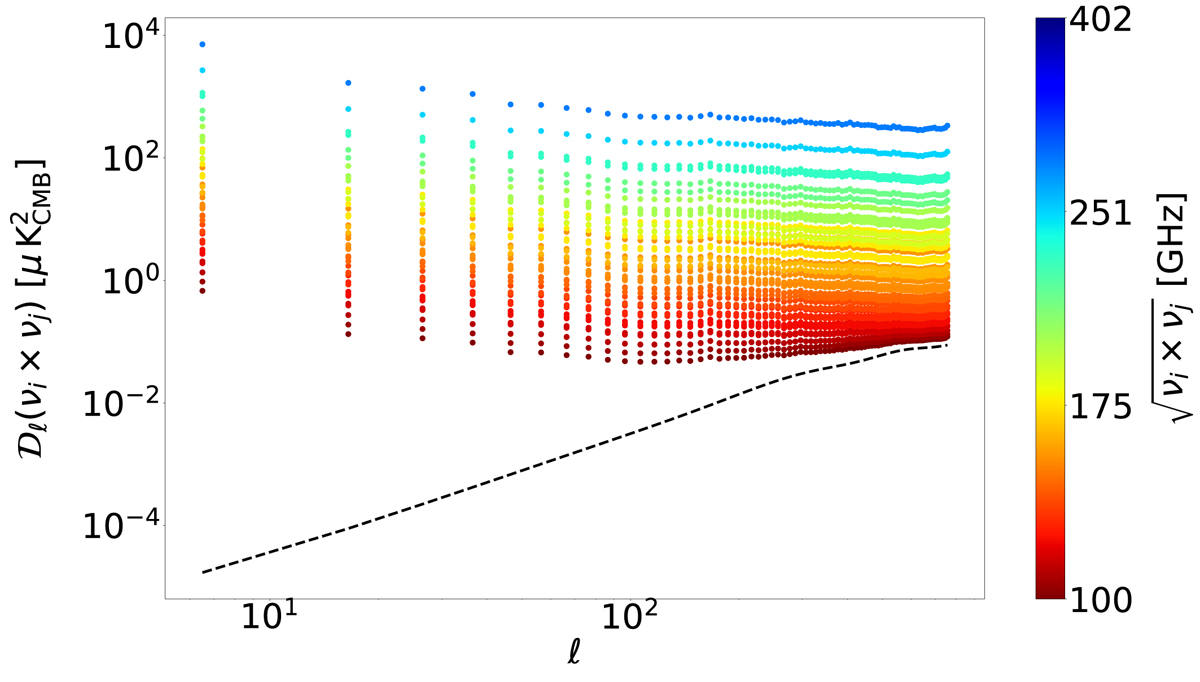
Mean value over the Nsim simulations of the B-mode angular power spectra 𝒟ℓ(νi × νj) for the d1c simulation type, with rsim = 0. The color bar spans all the Ncross spectra 𝒟ℓ(νi × νj), associated to their reduced cross-frequency ![]() , from 100 GHz (dark red) to 402 GHz (dark blue). The input CMB lensing power spectrum is shown as a black dashed line.
, from 100 GHz (dark red) to 402 GHz (dark blue). The input CMB lensing power spectrum is shown as a black dashed line.
Current usage metrics show cumulative count of Article Views (full-text article views including HTML views, PDF and ePub downloads, according to the available data) and Abstracts Views on Vision4Press platform.
Data correspond to usage on the plateform after 2015. The current usage metrics is available 48-96 hours after online publication and is updated daily on week days.
Initial download of the metrics may take a while.