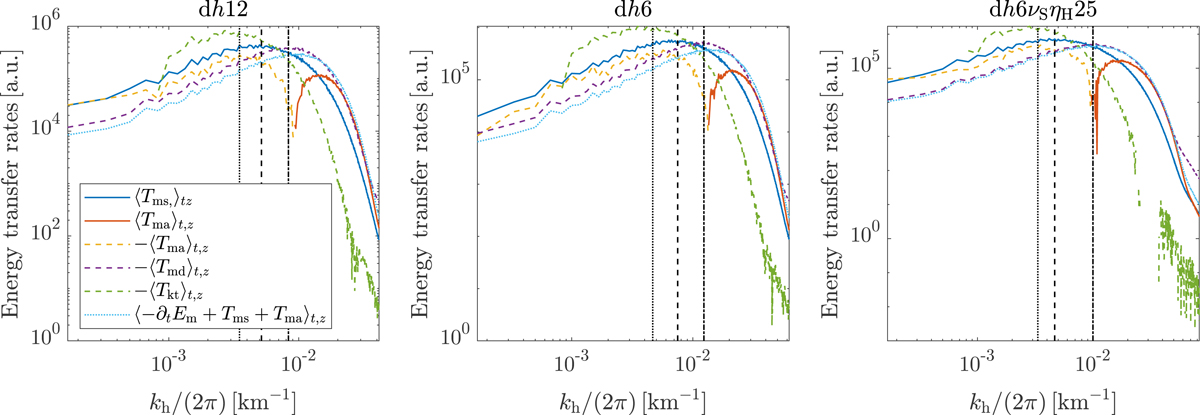
Fig. 6.
Download original image
Normalised energy transfer functions averaged over the time span of the kinematic phase and in space between z = −900 km and z = −700 km. Left: for the simulation dh12; centre: for the simulation dh6; and right: for the simulation dh6νSηH25. Solid colour curves represent sources of magnetic energy due to stretching (blue curves) and advection and compression (red curves) of magnetic fields, dashed colour curves represent magnetic energy losses due to advection and compression (yellow curves) and a Laplacian diffusion (purple curves) of magnetic fields. The green dashed curves represent the kinetic energy losses due to stretching of magnetic fields, whereas the light blue dotted lines represent the energy transfer imbalance −∂tEm + Tms + Tma. Black vertical lines denote the position of λms (dashed), λkt (dotted), and λmd (dash-dotted).
Current usage metrics show cumulative count of Article Views (full-text article views including HTML views, PDF and ePub downloads, according to the available data) and Abstracts Views on Vision4Press platform.
Data correspond to usage on the plateform after 2015. The current usage metrics is available 48-96 hours after online publication and is updated daily on week days.
Initial download of the metrics may take a while.