Fig. 5.
Download original image
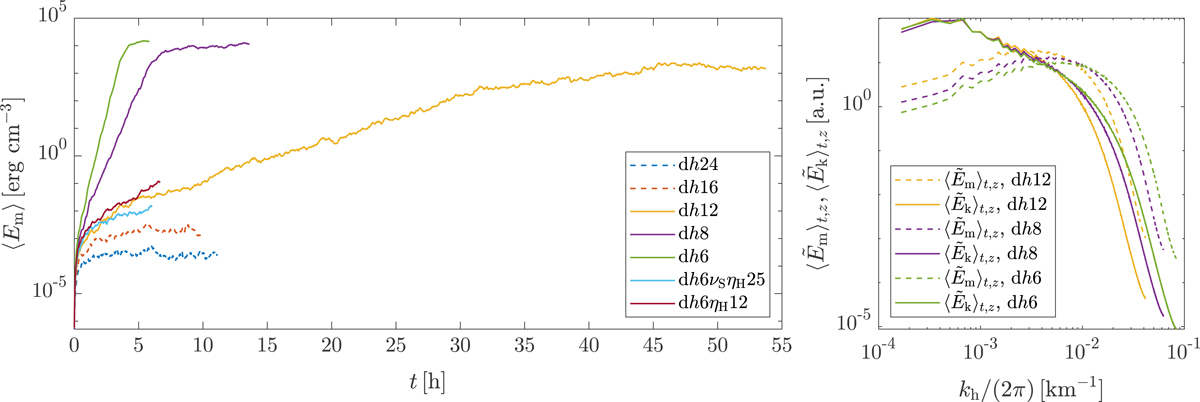
Growth of magnetic energy with time and kinetic and magnetic spectra. Left: temporal profiles of the magnetic energy density averaged over the full domain as function of time for simulations dh24, dh16, dh12, dh8, dh6, dh6νsηH25, and dh6ηH12. Solid lines denote simulations showing dynamo action, whereas dashed lines denote simulations without dynamo action. Right: spectra of the normalised kinetic energy density ![]() (solid lines) and magnetic energy density
(solid lines) and magnetic energy density ![]() (dashed lines) averaged over the time span of the kinematic phase and in space between z = −900 km and z = −700 km.
(dashed lines) averaged over the time span of the kinematic phase and in space between z = −900 km and z = −700 km.
Current usage metrics show cumulative count of Article Views (full-text article views including HTML views, PDF and ePub downloads, according to the available data) and Abstracts Views on Vision4Press platform.
Data correspond to usage on the plateform after 2015. The current usage metrics is available 48-96 hours after online publication and is updated daily on week days.
Initial download of the metrics may take a while.