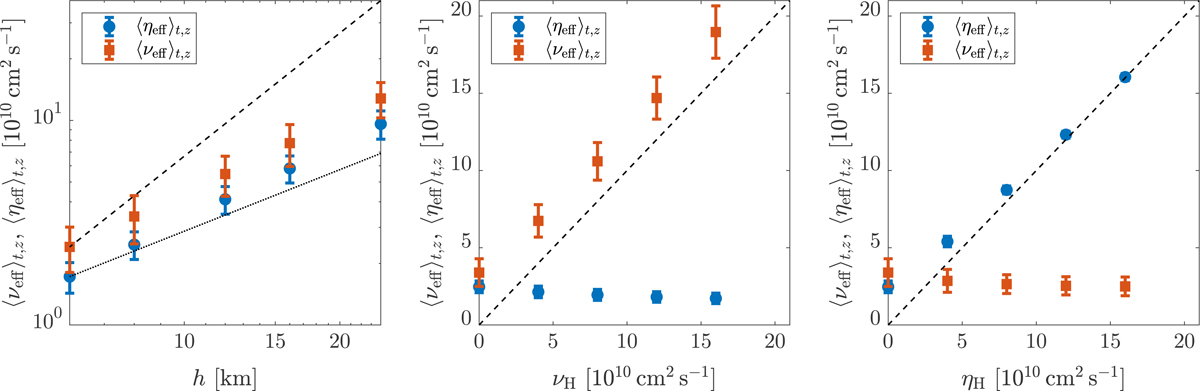
Fig. 2.
Download original image
Time and spatial averages of νeff (red squares) and ηeff (blue circles) for the simulations h24, h16, h12, h8, and h6 as function of grid spacing h (left panel); for the simulations h8, h8νH4, h8νH8, h8νH12, and h8νH16 as function of νH (centre panel); and for the simulations h8, h8ηH4, h8ηH8, h8ηH12, and h8ηH16 as function of ηH (right panel). The dashed and dotted black lines in the left panel are proportional to h2 and h, respectively, whereas the dashed black lines in the centre and right panels are proportional to νH and ηH, respectively. The error bars denote one standard deviation computed over time and vertical direction z.
Current usage metrics show cumulative count of Article Views (full-text article views including HTML views, PDF and ePub downloads, according to the available data) and Abstracts Views on Vision4Press platform.
Data correspond to usage on the plateform after 2015. The current usage metrics is available 48-96 hours after online publication and is updated daily on week days.
Initial download of the metrics may take a while.