Fig. 9.
Download original image
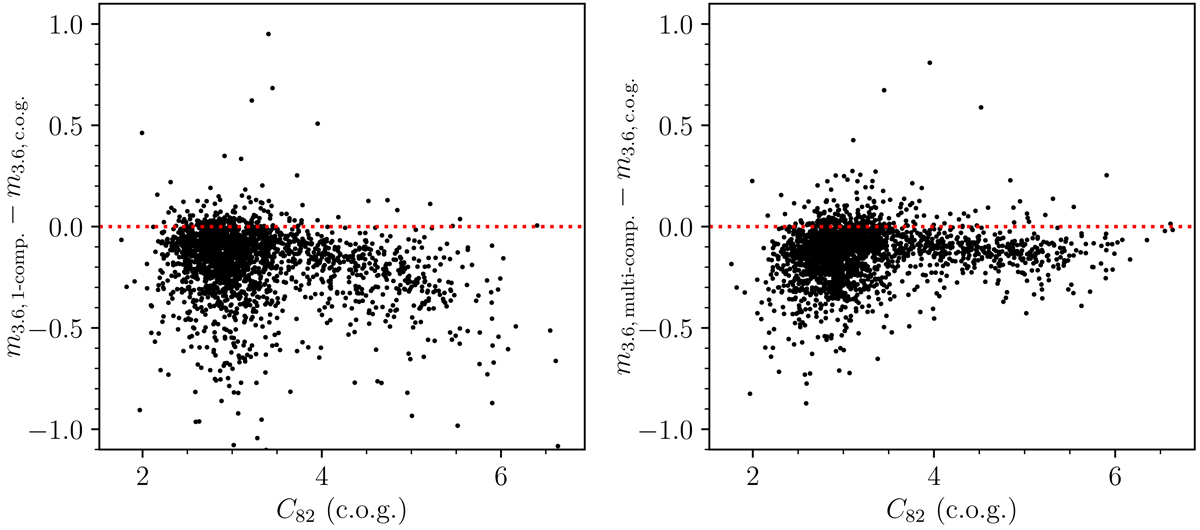
Comparing single- and multicomponent decomposition magnitudes with c.o.g. magnitudes. Left panel: difference between single-component decomposition total magnitudes and asymptotic magnitudes (P3; MM2015), as a function of c.o.g. concentration parameters (P3) for the original S4G sample. Right panel: as the left panel, but showing the difference between multicomponent decomposition total magnitudes (P4; Salo et al. 2015) and asymptotic magnitudes. While both decomposition types show slight offsets from the asymptotic magnitudes on average, as well as downward trends (brighter magnitudes) with increasing concentration, the downward trend in the single-component decompositions is much stronger than that in the multicomponent decompositions. Also, at least ∼0.06 magnitudes of offset in the multicomponent magnitudes arise because we applied no infinite aperture correction to the total flux (see Eq. (3), and Reach et al. 2005).
Current usage metrics show cumulative count of Article Views (full-text article views including HTML views, PDF and ePub downloads, according to the available data) and Abstracts Views on Vision4Press platform.
Data correspond to usage on the plateform after 2015. The current usage metrics is available 48-96 hours after online publication and is updated daily on week days.
Initial download of the metrics may take a while.