Fig. 8.
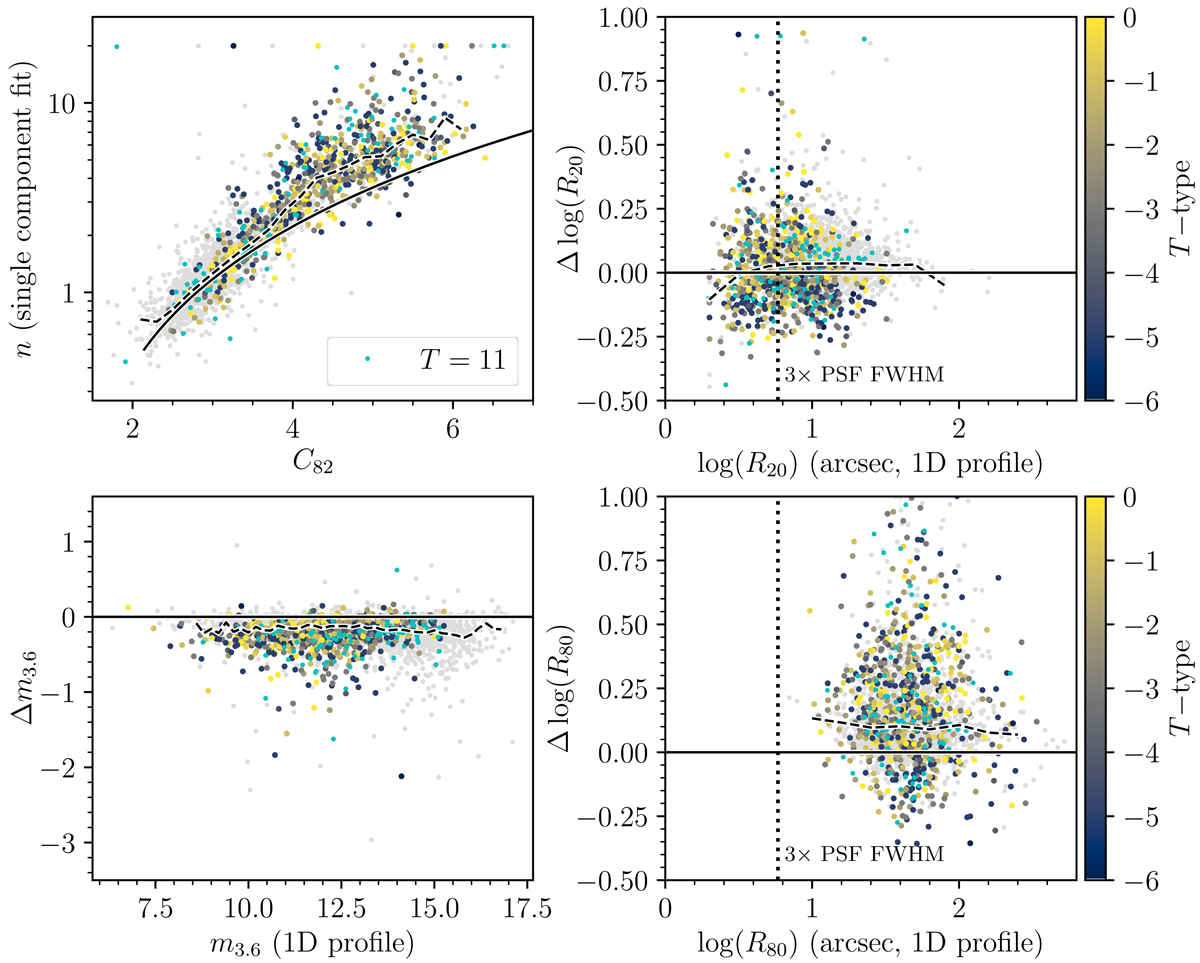
Download original image
Investigating the divergence between the Sérsic n derived from C82 and that measured from single-component 2D decompositions. Top-left panel: concentration parameter vs. Sérsic index, the latter being derived from single-component 2D decompositions for all S4G galaxies. The solid black line shows the theoretical behavior of C82 for Sérsic profiles of varying n. Here and in subsequent panels, the dashed black line shows the median of points in equal-width bins (bins with fewer than five points are ignored). Bottom-left panel: we show the difference between our asymptotic magnitudes and those derived from decompositions (negative numbers mean the asymptotic magnitudes are fainter). The solid black line here and in the following panels shows a value of 0 (no difference). Top-right panel: difference between R20 derived from single-component decompositions and those derived from our curves of growth for 3.6 μm imaging. The vertical dotted line shows the size of three IRAC 3.6 μm resolution elements. Bottom-right panel: the same as the top-right panel, but shows the behavior of R80. ETG data points are multicolored (with dwarfs in cyan), while LTGs are shown in gray.
Current usage metrics show cumulative count of Article Views (full-text article views including HTML views, PDF and ePub downloads, according to the available data) and Abstracts Views on Vision4Press platform.
Data correspond to usage on the plateform after 2015. The current usage metrics is available 48-96 hours after online publication and is updated daily on week days.
Initial download of the metrics may take a while.