Fig. 7.
Download original image
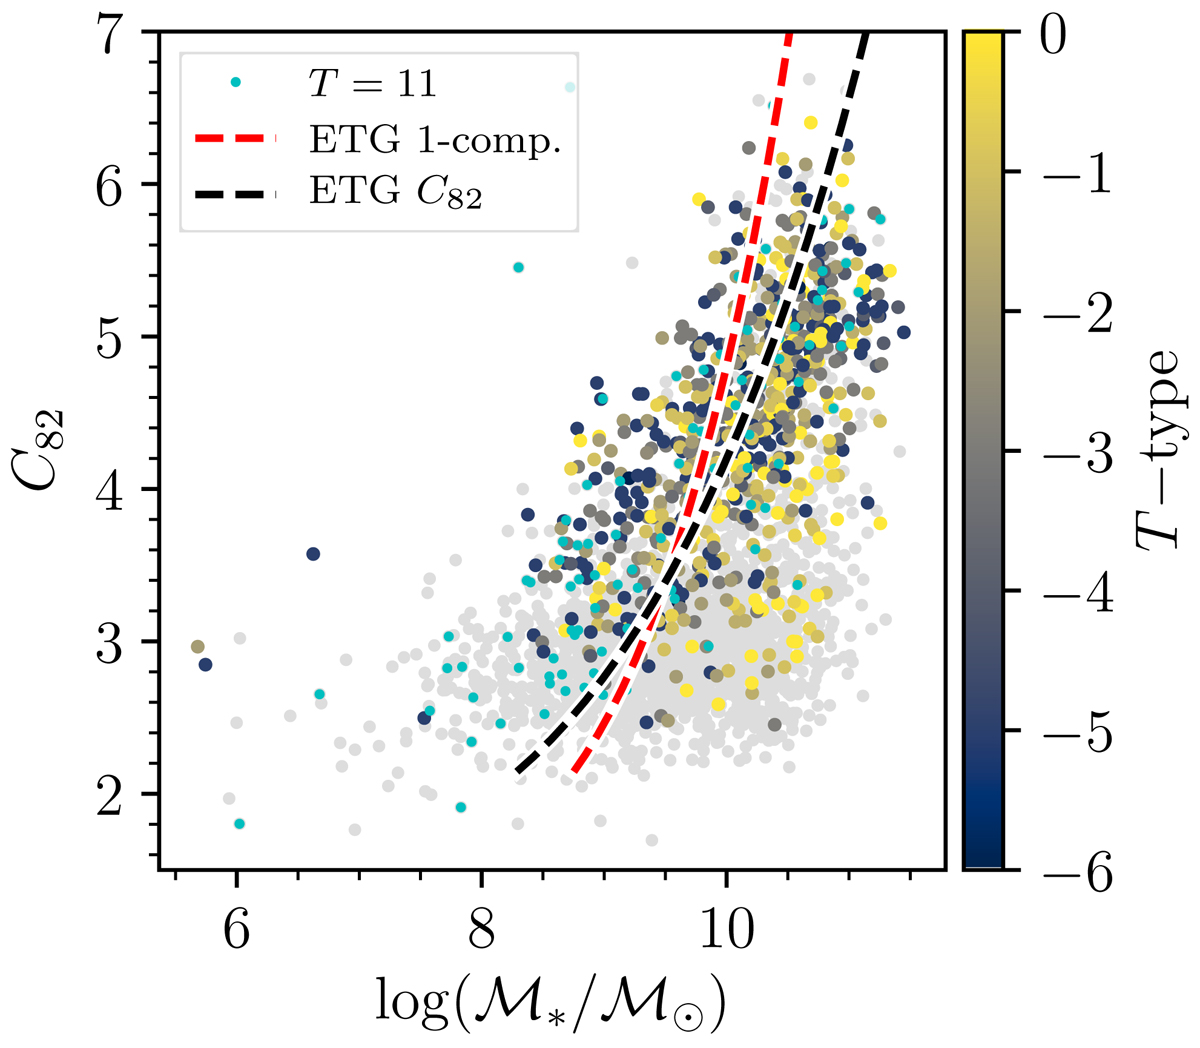
Correlation between concentration and stellar mass. Here and in all subsequent figures with this color scheme, we show ETGs (T ≤ 0) color-coded by T-type, while we show all S4G galaxies in gray. We show dwarf ETGs (T = 11) in cyan. The dashed black line shows a linear fit between log (ℳ*/ℳ⊙) and log (n), converted from C82, for ETGs (Eq. (7)). The red dashed line shows a similar fit, but here n was estimated for each ETG via single-component 2D decompositions (Eq. (8)).
Current usage metrics show cumulative count of Article Views (full-text article views including HTML views, PDF and ePub downloads, according to the available data) and Abstracts Views on Vision4Press platform.
Data correspond to usage on the plateform after 2015. The current usage metrics is available 48-96 hours after online publication and is updated daily on week days.
Initial download of the metrics may take a while.