Fig. 5.
Download original image
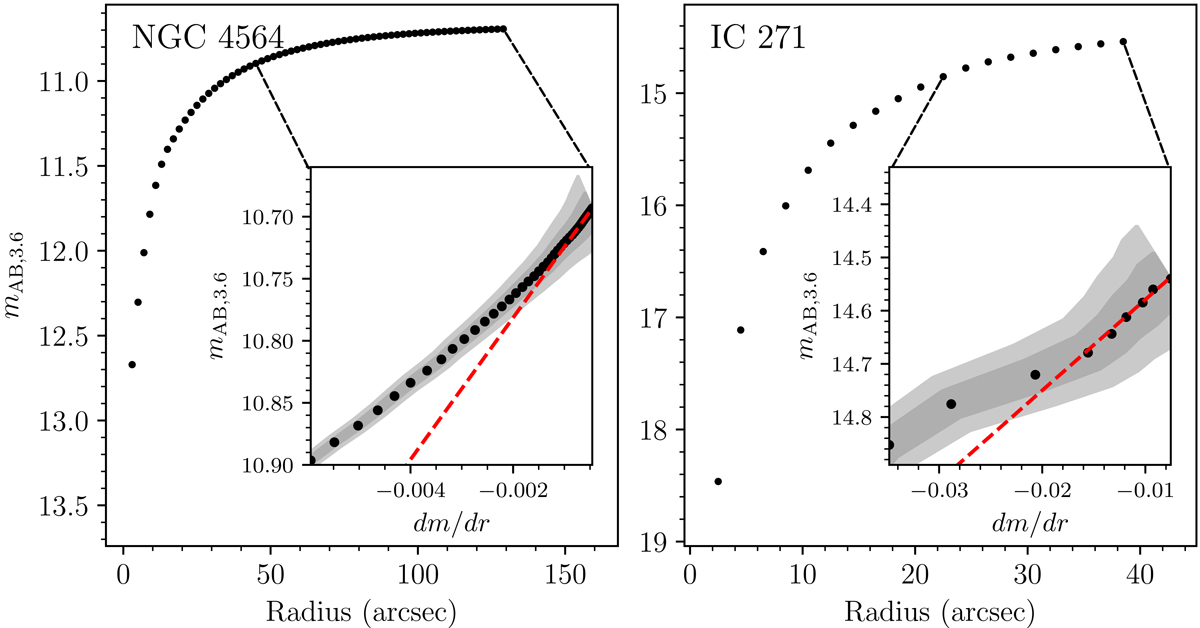
Example curves of growth for two galaxies, one bright with a large angular size (NGC 4564, left), the other faint with a small angular size (IC 271, right). Black points in the main panels show the total magnitudes enclosed within each radius (bin width 2″). The inset panels show the local gradients in the outskirts of the curves of growth. Red dashed lines show fits to the linear parts of these gradients chosen by eye; the y-intercepts of these red lines are the asymptotic magnitudes. Gray shaded regions show the 1σ (dark gray) and 2σ (light gray) perturbations to the curves of growth from adjusting the sky subtraction (see Sect. 3.3).
Current usage metrics show cumulative count of Article Views (full-text article views including HTML views, PDF and ePub downloads, according to the available data) and Abstracts Views on Vision4Press platform.
Data correspond to usage on the plateform after 2015. The current usage metrics is available 48-96 hours after online publication and is updated daily on week days.
Initial download of the metrics may take a while.