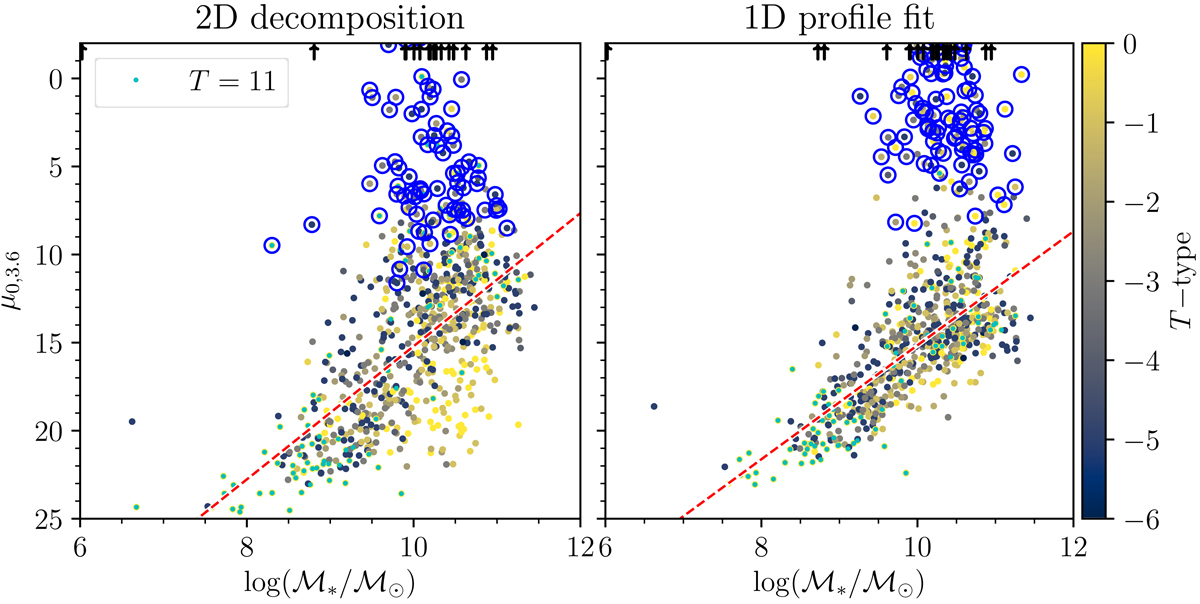
Fig. 14.
Download original image
3.6 μm central surface brightnesses (μ0, 3.6) vs. stellar mass. Left panel: μ0, 3.6 derived from single-component 2D decompositions, while the right panel shows μ0, 3.6 derived by fitting generalized single Sérsic functions to each galaxy’s radial surface brightness profile (fixed isophotal parameter, Δr = 2″, with aperture correction applied; see Sect. 3.2). Galaxies with fitted n > 7 are circled in blue. Linear fits to the two distributions are shown via the red dashed lines, excluding galaxies with ℳ*/ℳ⊙ < 8 and fitted n > 7. Points lying above the axis limits are shown as up-pointing arrows; each of these had fitted n > 7. ETG data points are multicolored (with dwarfs in cyan), while LTGs are shown in gray.
Current usage metrics show cumulative count of Article Views (full-text article views including HTML views, PDF and ePub downloads, according to the available data) and Abstracts Views on Vision4Press platform.
Data correspond to usage on the plateform after 2015. The current usage metrics is available 48-96 hours after online publication and is updated daily on week days.
Initial download of the metrics may take a while.