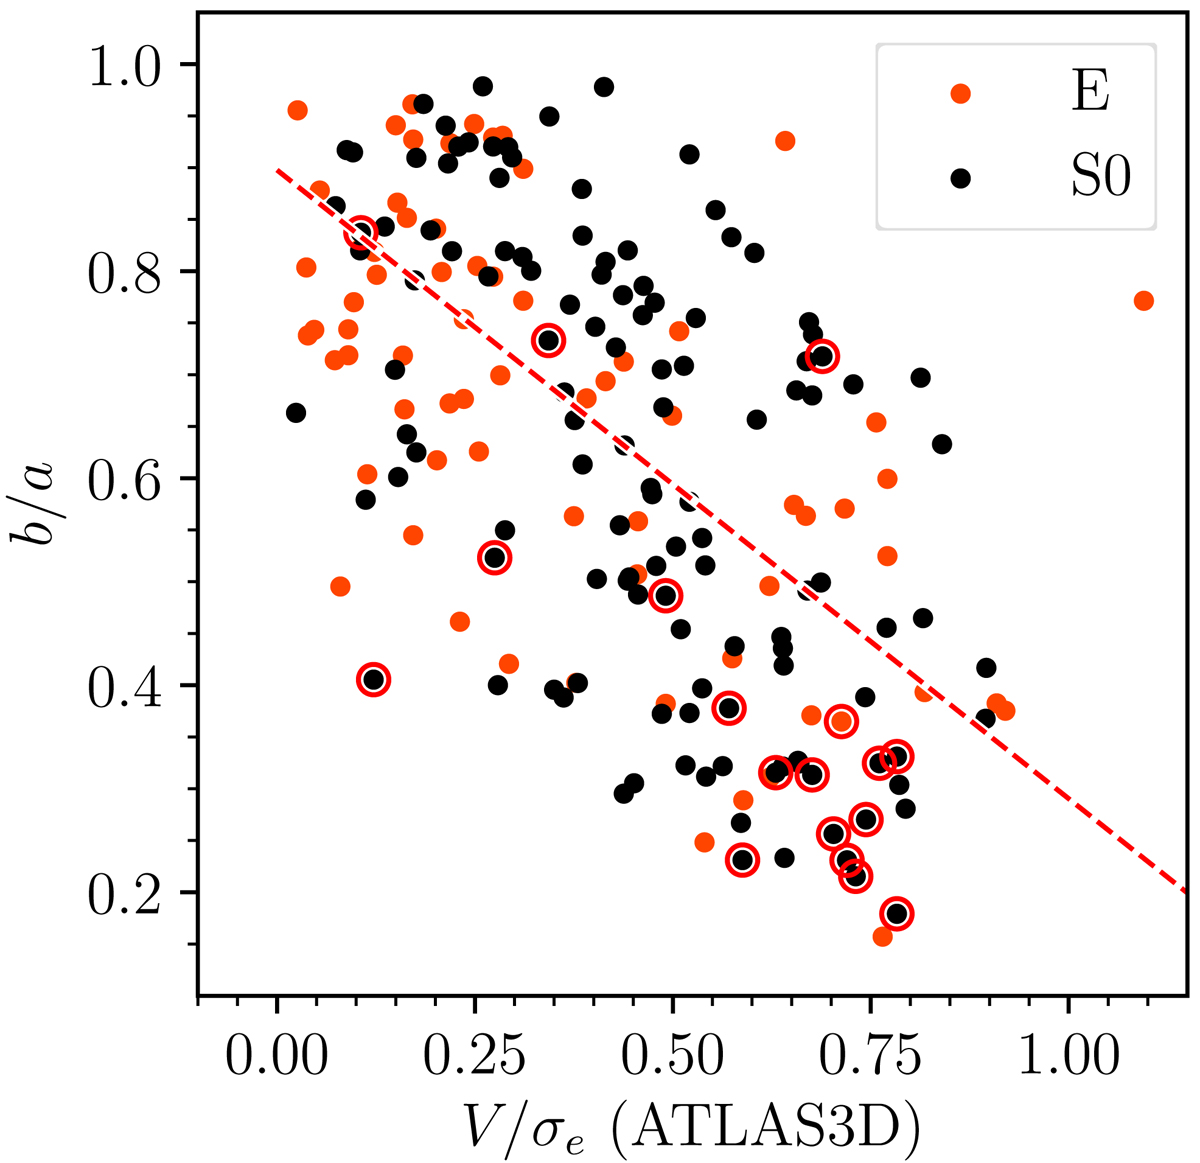
Fig. 12.
Download original image
Comparing V/σe values (denoting those measured at 1 Reff) from the ATLAS3D survey to isophotal axial ratios measured at R25.5 for galaxies matching between the S4G+ETG and ATLAS3D samples. Orange points denote elliptical galaxies, while black points denote S0s. The red dashed line shows a linear fit to all points. Points circled in red are edge-on disks (denoted “spindle” by Buta et al. 2015), with unreliable axial ratios.
Current usage metrics show cumulative count of Article Views (full-text article views including HTML views, PDF and ePub downloads, according to the available data) and Abstracts Views on Vision4Press platform.
Data correspond to usage on the plateform after 2015. The current usage metrics is available 48-96 hours after online publication and is updated daily on week days.
Initial download of the metrics may take a while.