Fig. 11.
Download original image
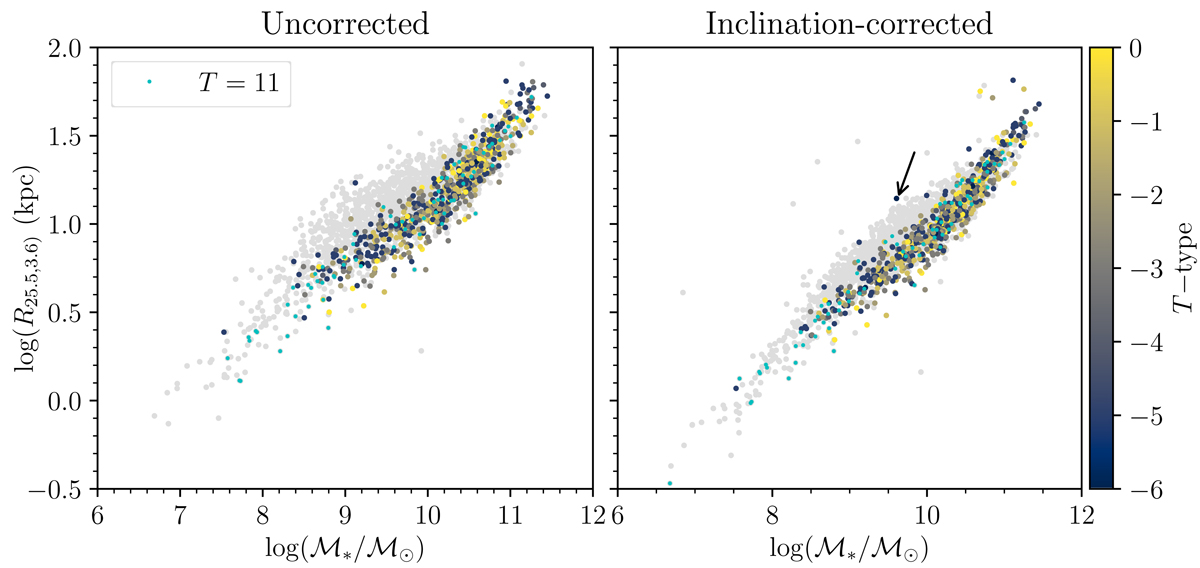
Isophotal mass-size relation. Left panel: the relation between R25.5, 3.6 and stellar mass, in which R25.5, 3.6 was derived from the raw surface brightness profiles. Right panel: the same but with R25.5, 3.6 corrected for inclination, measured from the outermost isophote shapes’ axial ratios. ETG data points are multicolored (with dwarfs in cyan), while LTGs are shown in gray. The arrow indicates the galaxy IC 3413 (see text).
Current usage metrics show cumulative count of Article Views (full-text article views including HTML views, PDF and ePub downloads, according to the available data) and Abstracts Views on Vision4Press platform.
Data correspond to usage on the plateform after 2015. The current usage metrics is available 48-96 hours after online publication and is updated daily on week days.
Initial download of the metrics may take a while.