Fig. 10.
Download original image
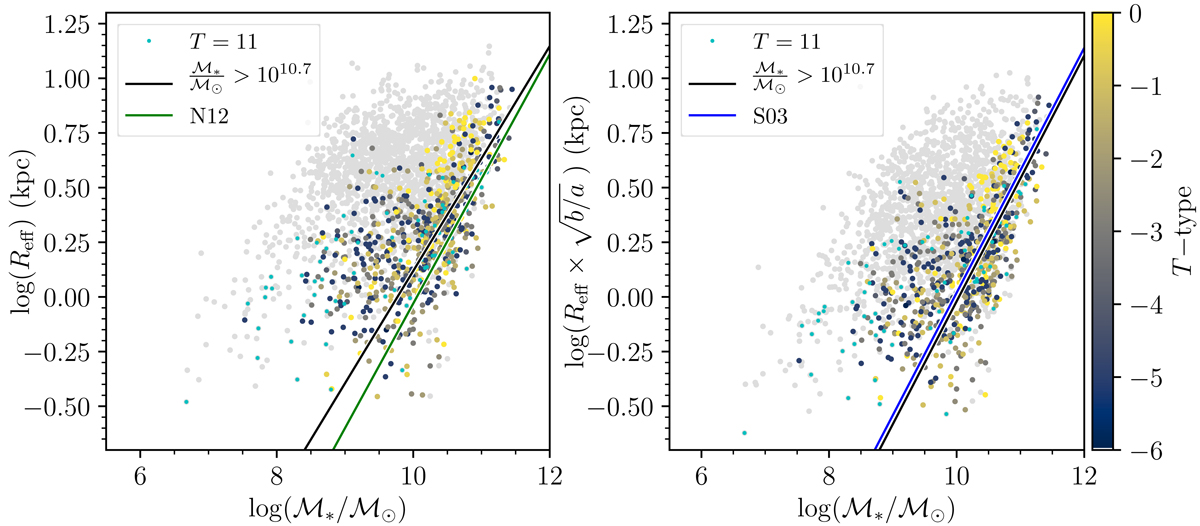
Effective radius mass-size relation. Left panel: our effective radius values (derived from 3.6 μm imaging) plotted against stellar mass, with a linear fit to ETGs with masses > 1010.7 ℳ⊙ shown in black and the z = 0.25 ETG mass-size relation from Newman et al. (2012) shown in green (labeled N12). Right panel: the same as the left, but here Reff has been adjusted by a factor of ![]() to adjust the values to those measured using circular apertures, following Shen et al. (2003), whose fit is overplotted in blue (labeled S03). ETG data points are multicolored (with dwarfs in cyan), while LTGs are shown in gray.
to adjust the values to those measured using circular apertures, following Shen et al. (2003), whose fit is overplotted in blue (labeled S03). ETG data points are multicolored (with dwarfs in cyan), while LTGs are shown in gray.
Current usage metrics show cumulative count of Article Views (full-text article views including HTML views, PDF and ePub downloads, according to the available data) and Abstracts Views on Vision4Press platform.
Data correspond to usage on the plateform after 2015. The current usage metrics is available 48-96 hours after online publication and is updated daily on week days.
Initial download of the metrics may take a while.