Free Access
Fig. 5
Download original image
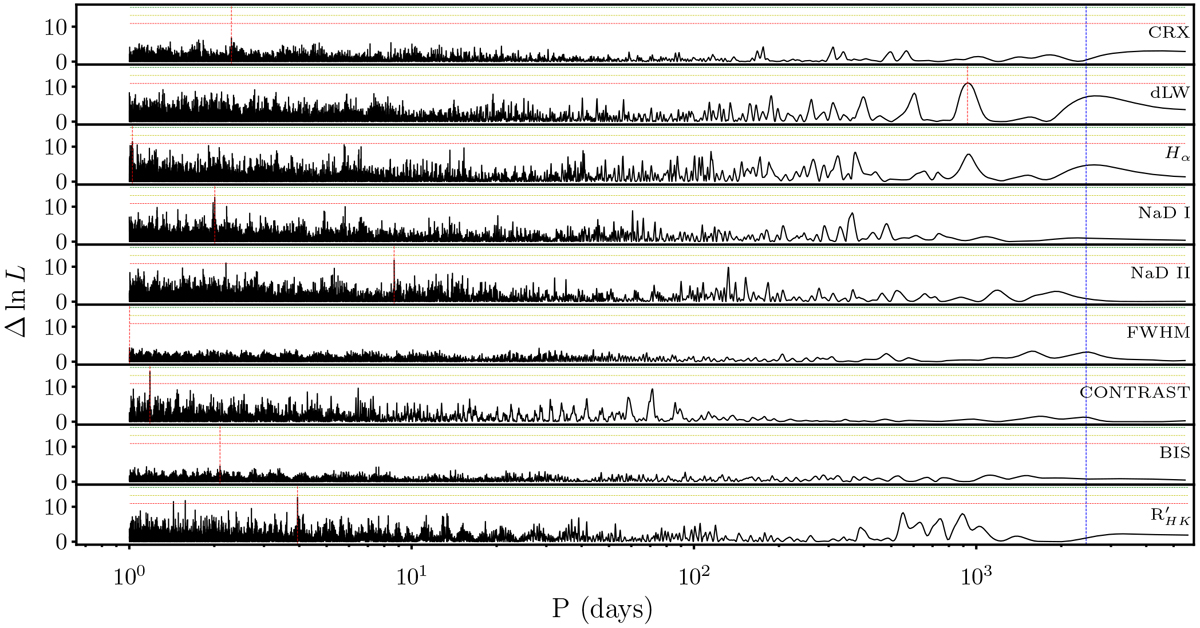
Δ ln L periodograms of activity indicators for HD 105779. The vertical red lines show the peak period of the signal in each. The horizontal lines mark the FAP values as in Fig. 2. The blue vertical line shows the period of the proposed planet.
Current usage metrics show cumulative count of Article Views (full-text article views including HTML views, PDF and ePub downloads, according to the available data) and Abstracts Views on Vision4Press platform.
Data correspond to usage on the plateform after 2015. The current usage metrics is available 48-96 hours after online publication and is updated daily on week days.
Initial download of the metrics may take a while.