Fig. 4
Download original image
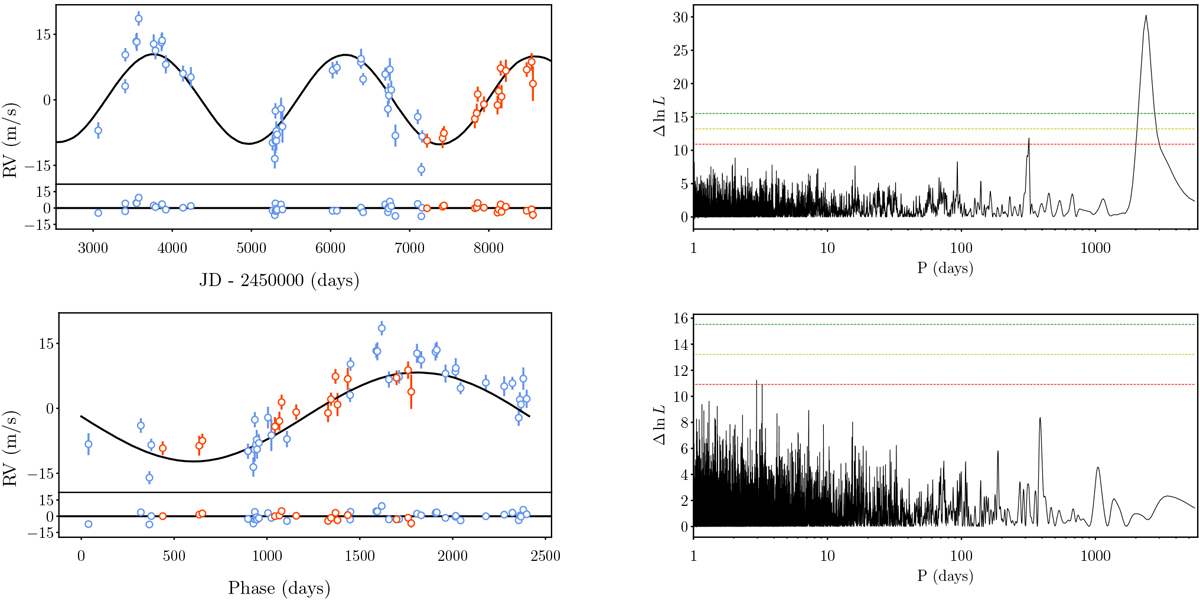
Radial velocities and resulting periodograms of HD 105779. Top left: the Keplerian fit to the input RV data. The bottom panel of this figure shows the residual. Top right: Δ ln L periodogram of input RVs for HD 105779. The periodogram shows a peak at 2388 days. The horizontal dashed lines shows 0.001 (Green), 0.01 (Yellow) and 0.1 (Red) FAP values. Bottom left: data phase folded to pre RVs (Blue) and post RVs (Orange). Bottom right: Δ ln L periodogram of residuals.
Current usage metrics show cumulative count of Article Views (full-text article views including HTML views, PDF and ePub downloads, according to the available data) and Abstracts Views on Vision4Press platform.
Data correspond to usage on the plateform after 2015. The current usage metrics is available 48-96 hours after online publication and is updated daily on week days.
Initial download of the metrics may take a while.