Fig. A.2
Download original image
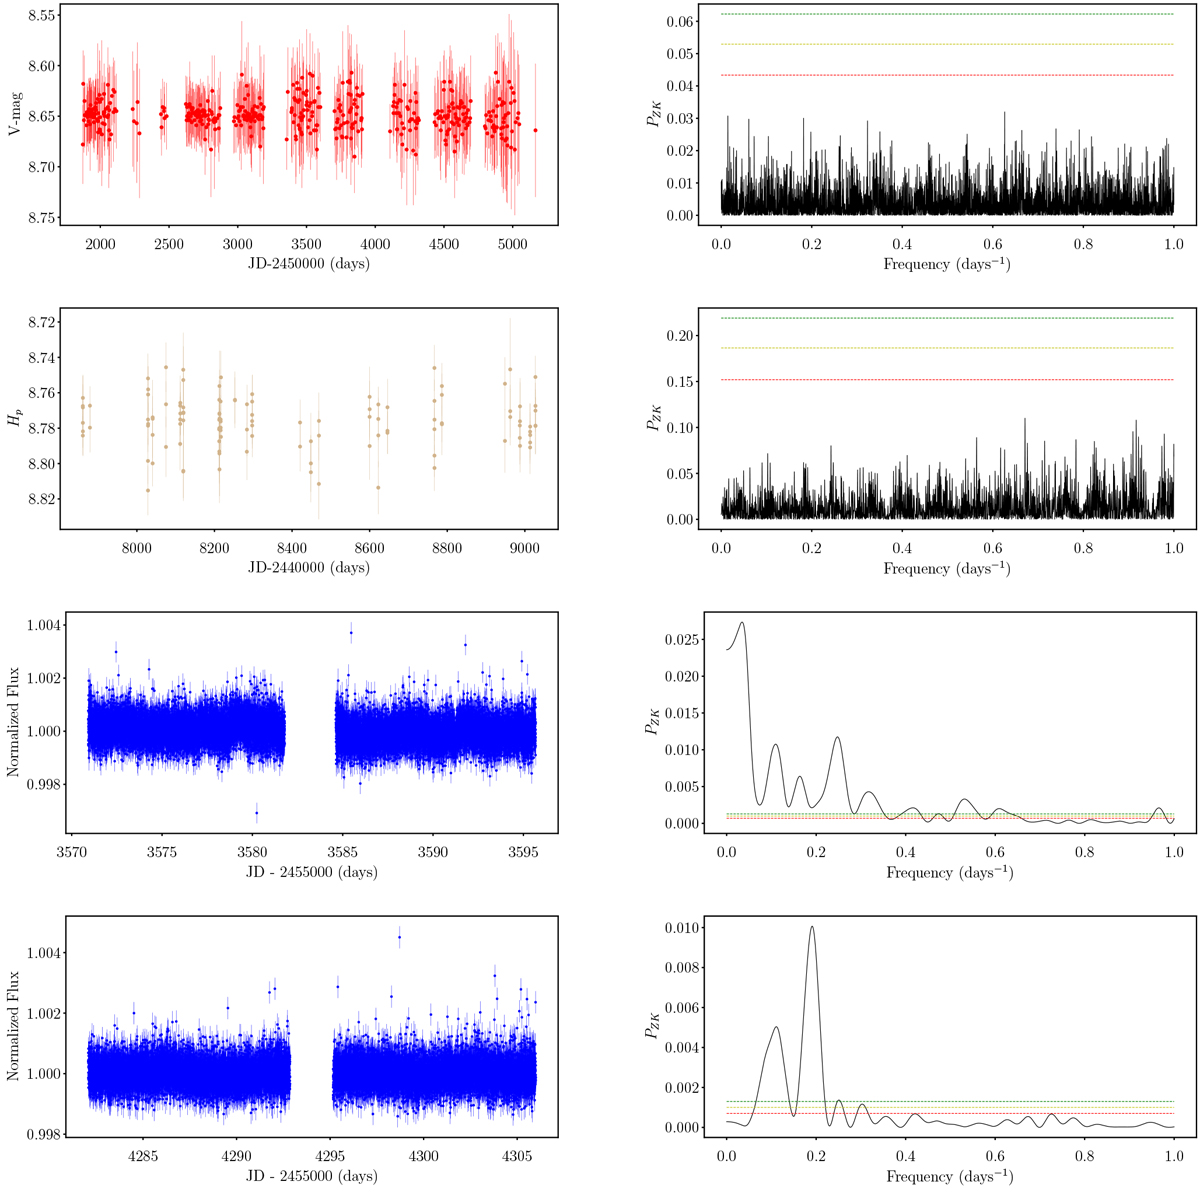
Photometry analysis for HD 105779. Row 1, Left: input ASAS V Band photometric magnitudes Row 1, Right: GLS peri-odogram of ASAS data. The periodogram has a peak at ~ 1.59 days. Row 2, Left: Input HIPPARCOS magnitudes. Row 2, Right: GLS periodogram of HIPPARCOS data shows a non significant peak at ~ 1.49 days. Row 3, Left: Input TESS data from sector 10. Row 3, Right: GLS periodogram of TESS flux values shows a peak at ~ 29.13 days. Row 4, Left: TESS data from sector 36. Row 4: GLS periodogram of TESS flux values shows a peak at ~ 5.23 days.
Current usage metrics show cumulative count of Article Views (full-text article views including HTML views, PDF and ePub downloads, according to the available data) and Abstracts Views on Vision4Press platform.
Data correspond to usage on the plateform after 2015. The current usage metrics is available 48-96 hours after online publication and is updated daily on week days.
Initial download of the metrics may take a while.