Fig. 1
Download original image
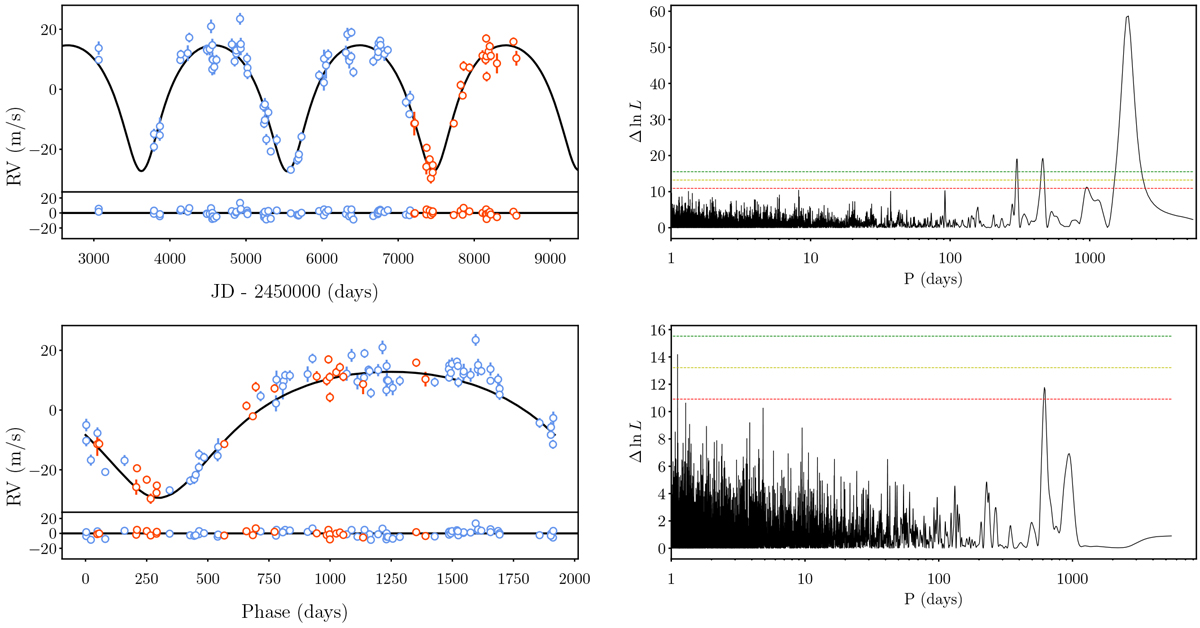
Radial velocities and resulting periodograms of HD 103891. Top left: the HARPS-SERVAL NZP-corrected RVs. pre RVs are colored blue and post RVs are colored red. The best-fit Keplerian model is shown with the solid black line. The bottom panel of this figure shows the residuals. Top right: Δ ln L periodogram of the input RVs. The periodogram shows a peak at 1893 days. The horizontal dashed lines show 0.001 (Green), 0.01 (Yellow), and 0.1 (Red) FAP values. Bottom left: the RV data and Keplerian model, phase folded at the best-fit orbital period. Bottom right: Δ ln L periodogram of the residuals.
Current usage metrics show cumulative count of Article Views (full-text article views including HTML views, PDF and ePub downloads, according to the available data) and Abstracts Views on Vision4Press platform.
Data correspond to usage on the plateform after 2015. The current usage metrics is available 48-96 hours after online publication and is updated daily on week days.
Initial download of the metrics may take a while.