Fig. 8
Download original image
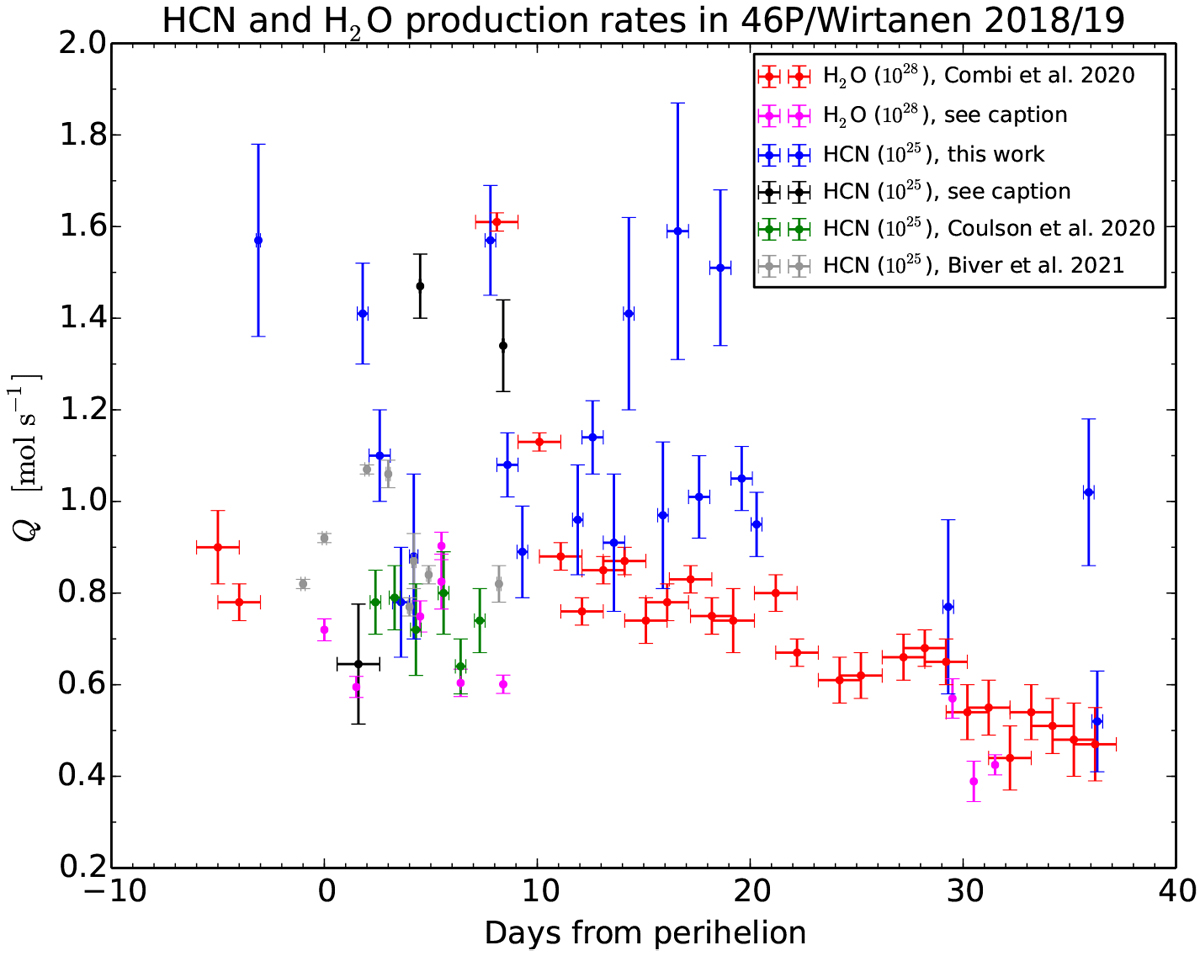
HCN and H20 production rates in 46P/Wirtanen as a function of days from perihelion (12.9 December 2018 UT). The HCN rates (blue) were determined from the intensities (only those detected above the 3σ- level) in Table 4. The water production rates (red) contemporary with our QHCN results, are from Combi et al. (2020). The perihelion value of ![]() from Moulane et al. (2019) and the post-perihelion values from Saki et al. (2020) (14 and 19 December), Roth et al. (2021a) (18 December), Bonev et al. (2021) (17/18 December), Khan et al. (2021) (21 December), and McKay et al. (2021) (11–13 January) are included (magenta). Also, the QHCN as estimated by Wang et al. (2020) (14/15 December), Bonev et al. (2021) (17 December) and Khan et al. (2021) (21 December) are shown with black markers. The HCN observations by Coulson et al. (2020) have been included using green markers and those from Biver et al. (2021) are shown with grey markers. The lengths of the error bars in the vertical direction relate to the 1σ uncertainties in the rates while the lengths in horizontal direction reflect the time length over which they refer to. As indicated, the HCN rates should be scaled by 1025 and the water rates by 1028.
from Moulane et al. (2019) and the post-perihelion values from Saki et al. (2020) (14 and 19 December), Roth et al. (2021a) (18 December), Bonev et al. (2021) (17/18 December), Khan et al. (2021) (21 December), and McKay et al. (2021) (11–13 January) are included (magenta). Also, the QHCN as estimated by Wang et al. (2020) (14/15 December), Bonev et al. (2021) (17 December) and Khan et al. (2021) (21 December) are shown with black markers. The HCN observations by Coulson et al. (2020) have been included using green markers and those from Biver et al. (2021) are shown with grey markers. The lengths of the error bars in the vertical direction relate to the 1σ uncertainties in the rates while the lengths in horizontal direction reflect the time length over which they refer to. As indicated, the HCN rates should be scaled by 1025 and the water rates by 1028.
Current usage metrics show cumulative count of Article Views (full-text article views including HTML views, PDF and ePub downloads, according to the available data) and Abstracts Views on Vision4Press platform.
Data correspond to usage on the plateform after 2015. The current usage metrics is available 48-96 hours after online publication and is updated daily on week days.
Initial download of the metrics may take a while.