Fig. 5
Download original image
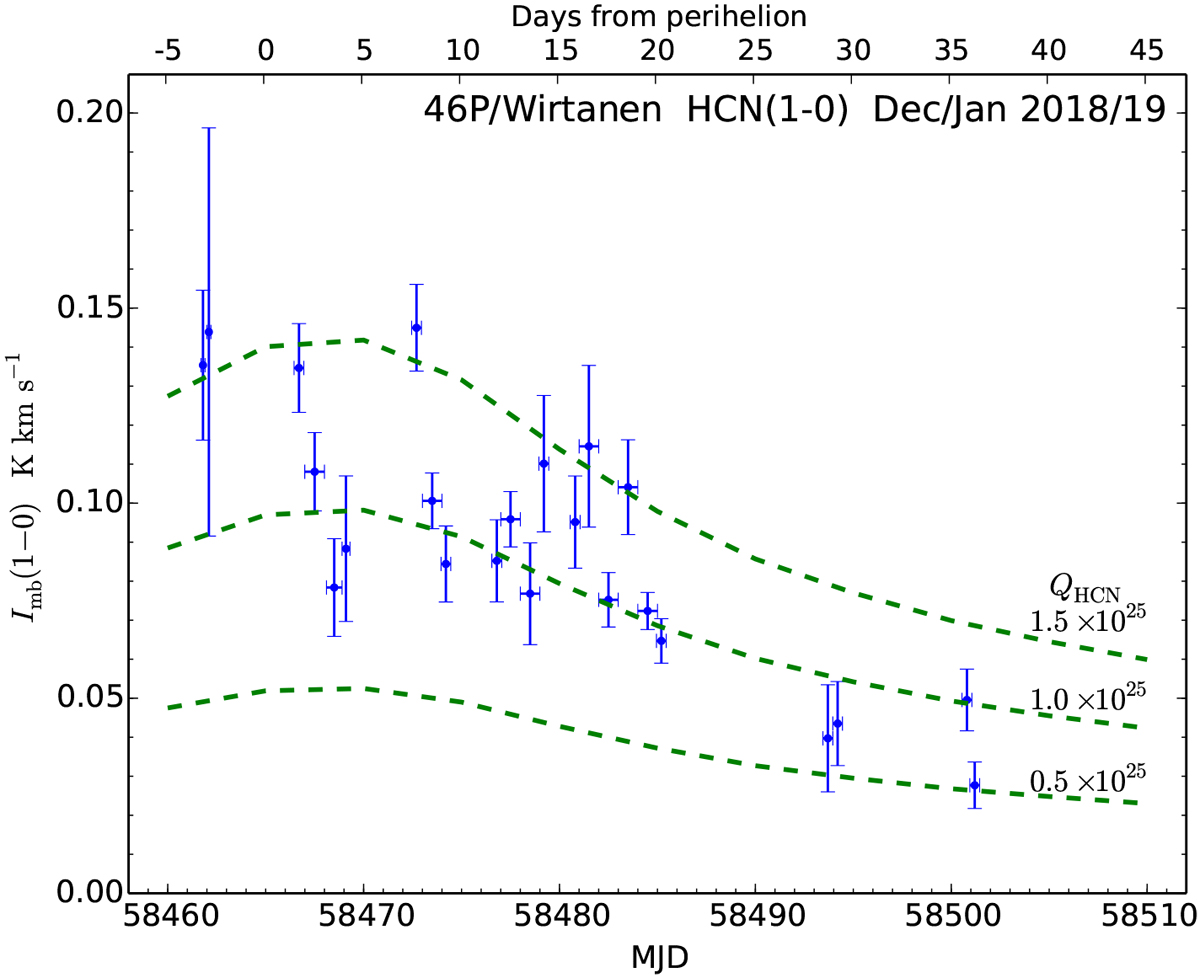
OSO 20-m HCN 1–0 monitoring data towards 46P/Wirtanen in December 2018 and January 2019. The data points (blue marker with vertical lσ errors bars; horizontal bars indicate the range of observations), which are also listed in Table 4, represent the integrated intensity as a function of MJD or days from perihelion. The dashed lines represent the results from the radiative transfer modelling (see Sect. 4) using three different HCN production rates from 0.5 × 1025mol s−1 to 1.5 × 1025 mol s−1 as indicated for a temperature of 70 K and ![]() .
.
Current usage metrics show cumulative count of Article Views (full-text article views including HTML views, PDF and ePub downloads, according to the available data) and Abstracts Views on Vision4Press platform.
Data correspond to usage on the plateform after 2015. The current usage metrics is available 48-96 hours after online publication and is updated daily on week days.
Initial download of the metrics may take a while.