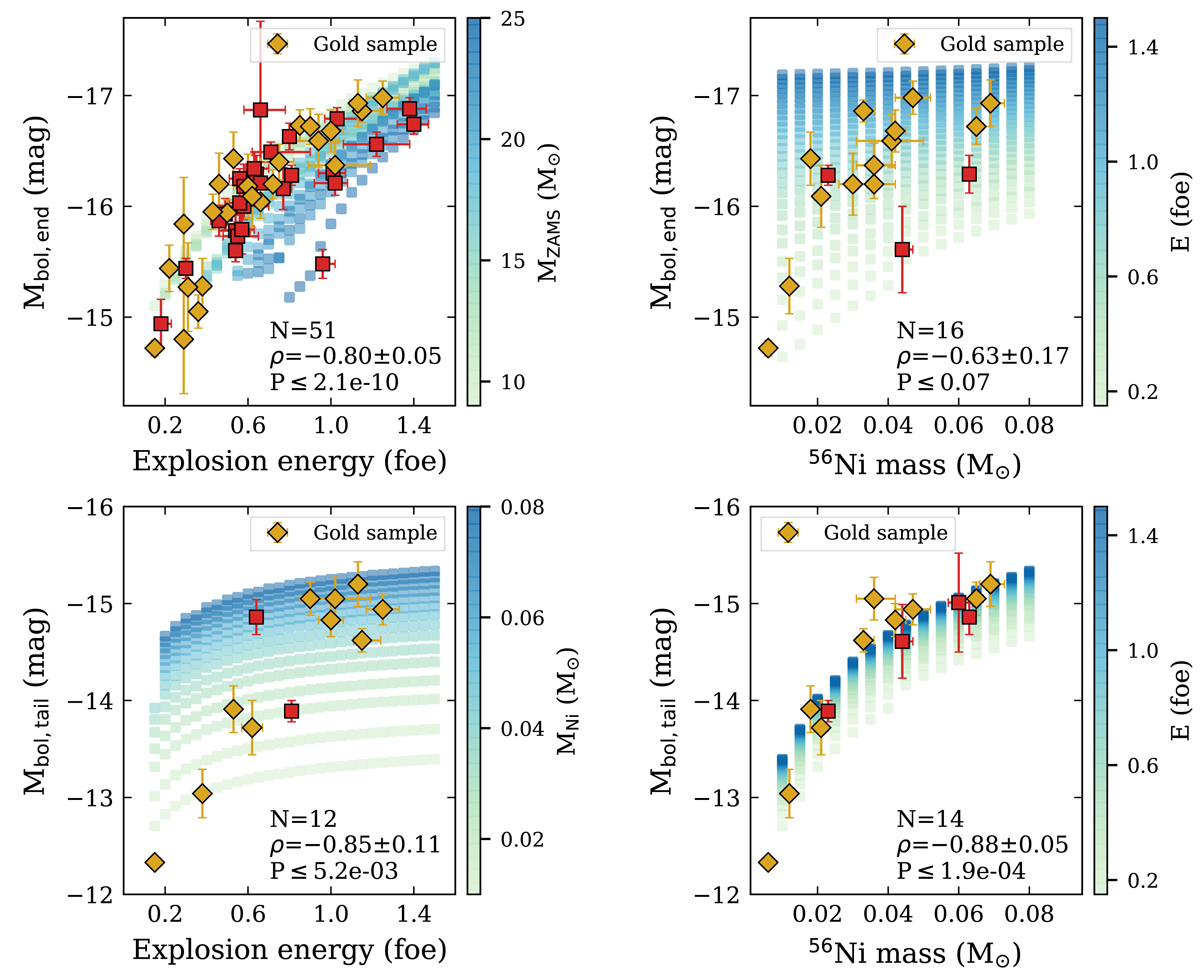
Fig. 4.
Download original image
Correlations between physical parameters and magnitude at different epochs. Top panels: correlations between Mbol, end and two physical parameters: E (top left) and MNi (top right). Bottom panels: correlations between Mbol, tail and two physical parameters: E (bottom left) and MNi (bottom right). The yellow and red markers refer to the results obtained from the CSP-I SN II sample (yellow markers indicate gold events). Each subplot contains the number of events (N), the Pearson correlation coefficient (ρ), and the probability of detecting a correlation by chance (P) for the full sample. Results from the models are colour-coded based on different physical parameters. The physical parameters not being varied –if they do not appear in the plot– are fixed at MZAMS = 10 M⊙, MNi = 0.03 M⊙, and 56Ni mixing = 0.5. Some observations fall outside the range of the model parameters because of the fixed physical parameters. Changes in the fixed values represent different ranges of model parameters.
Current usage metrics show cumulative count of Article Views (full-text article views including HTML views, PDF and ePub downloads, according to the available data) and Abstracts Views on Vision4Press platform.
Data correspond to usage on the plateform after 2015. The current usage metrics is available 48-96 hours after online publication and is updated daily on week days.
Initial download of the metrics may take a while.