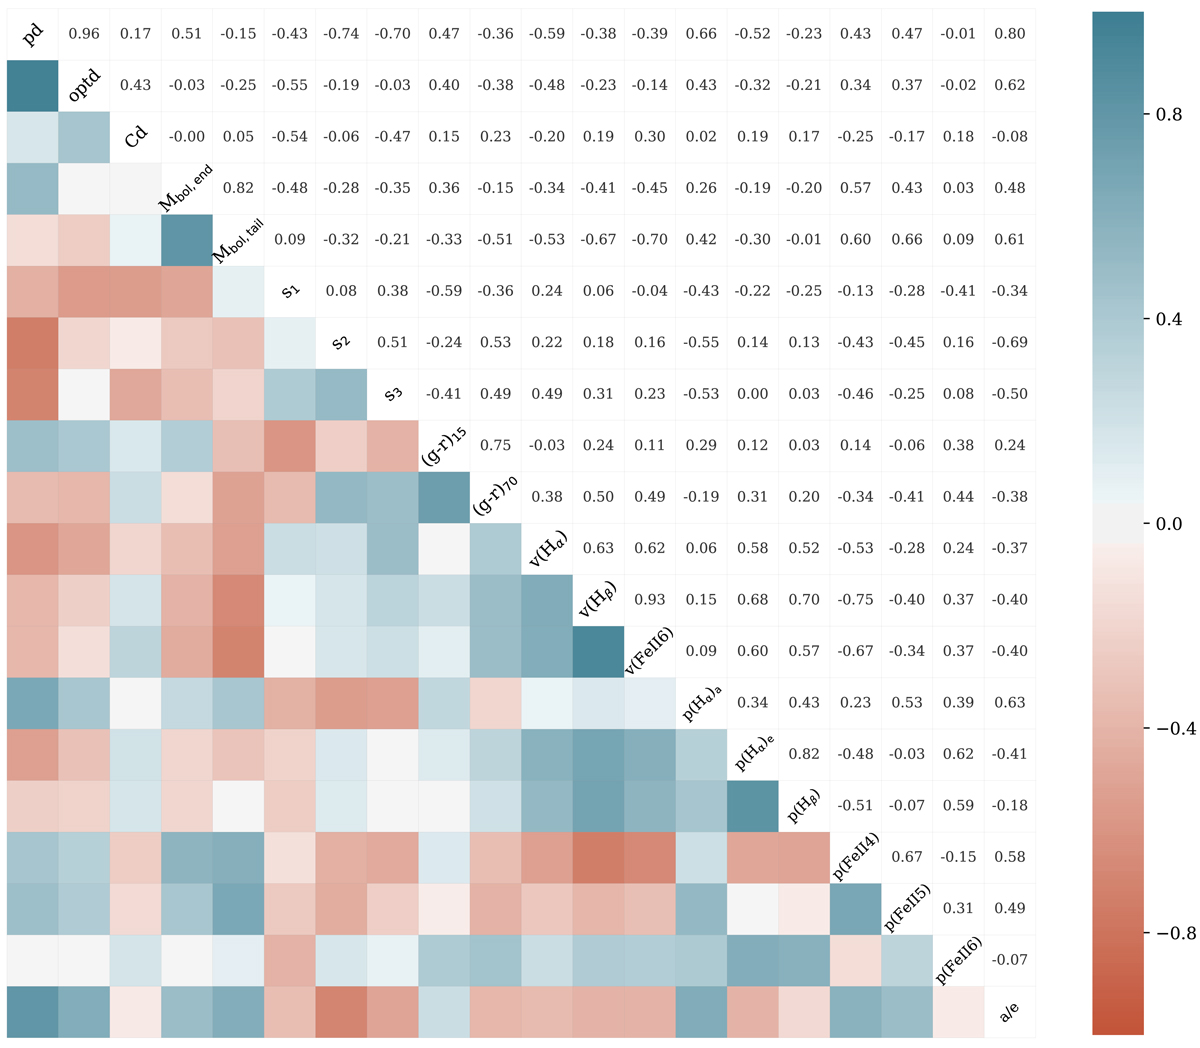
Fig. B.1.
Download original image
Correlation matrix of the bolometric LC, spectral, and colour parameters used in the current study. The Pearson correlation coefficients are presented in the upper triangle, while in the lower triangle the correlation coefficients are colour-coded. The diagonal middle line shows the name of the parameters used: pd, optd, Cd, Mbol, end, Mbol, tail, s1, s2, s3, (g−r) at 15 and 70 days after explosion, line velocity of Hα, Hβ, Fe IIλ5169, pEW(Hα) of absorption component, pEW(Hα) of emission component, pEW(Hβ), pEW(Fe IIλ4924), pEW(Fe IIλ5018), pEW(Fe IIλ5169), and a/e.
Current usage metrics show cumulative count of Article Views (full-text article views including HTML views, PDF and ePub downloads, according to the available data) and Abstracts Views on Vision4Press platform.
Data correspond to usage on the plateform after 2015. The current usage metrics is available 48-96 hours after online publication and is updated daily on week days.
Initial download of the metrics may take a while.