Fig. 8
Download original image
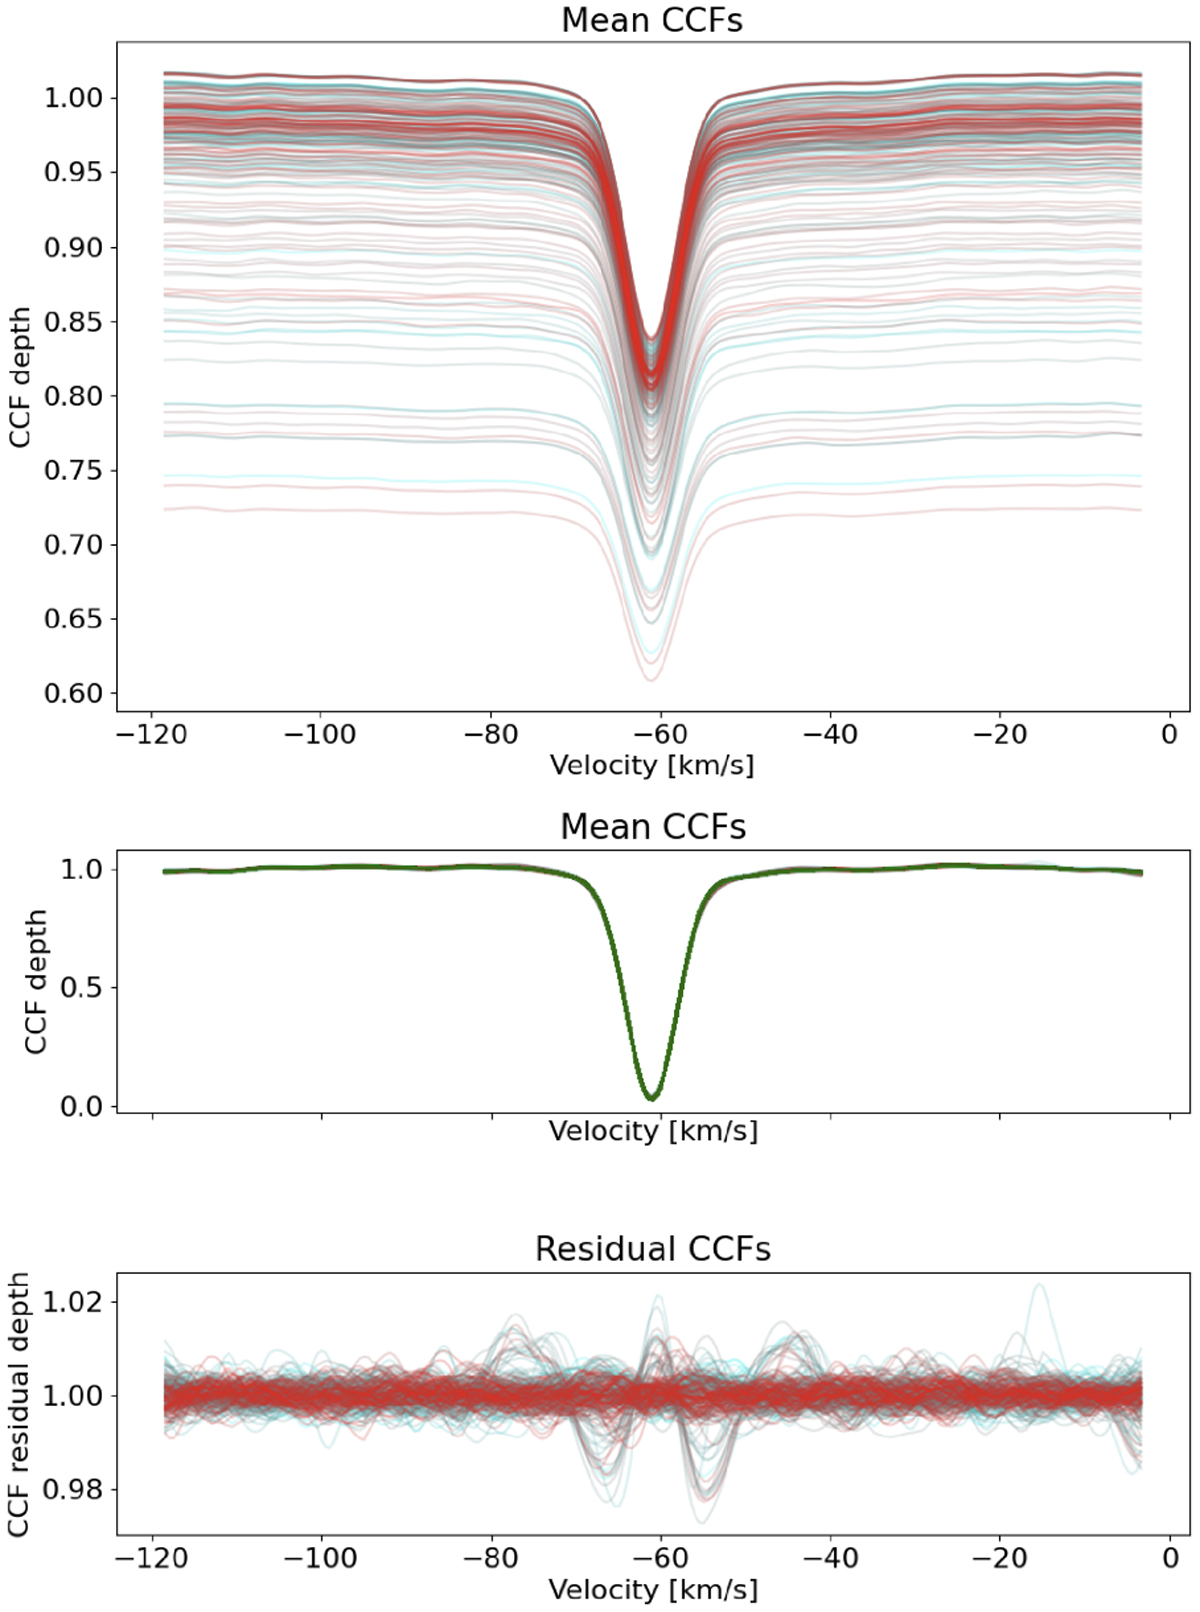
CCF template matching. The top panel shows the weighted mean CCFs obtained for each spectrum of TOI-1759, where the color code shows the first epoch in dark blue and the last epoch in dark red. The middle panel shows the same CCFs normalized to the polynomial fit to match the template CCF (green line). The lower panel shows the CCFs with the template CCF subtracted.
Current usage metrics show cumulative count of Article Views (full-text article views including HTML views, PDF and ePub downloads, according to the available data) and Abstracts Views on Vision4Press platform.
Data correspond to usage on the plateform after 2015. The current usage metrics is available 48-96 hours after online publication and is updated daily on week days.
Initial download of the metrics may take a while.