Fig. 6
Download original image
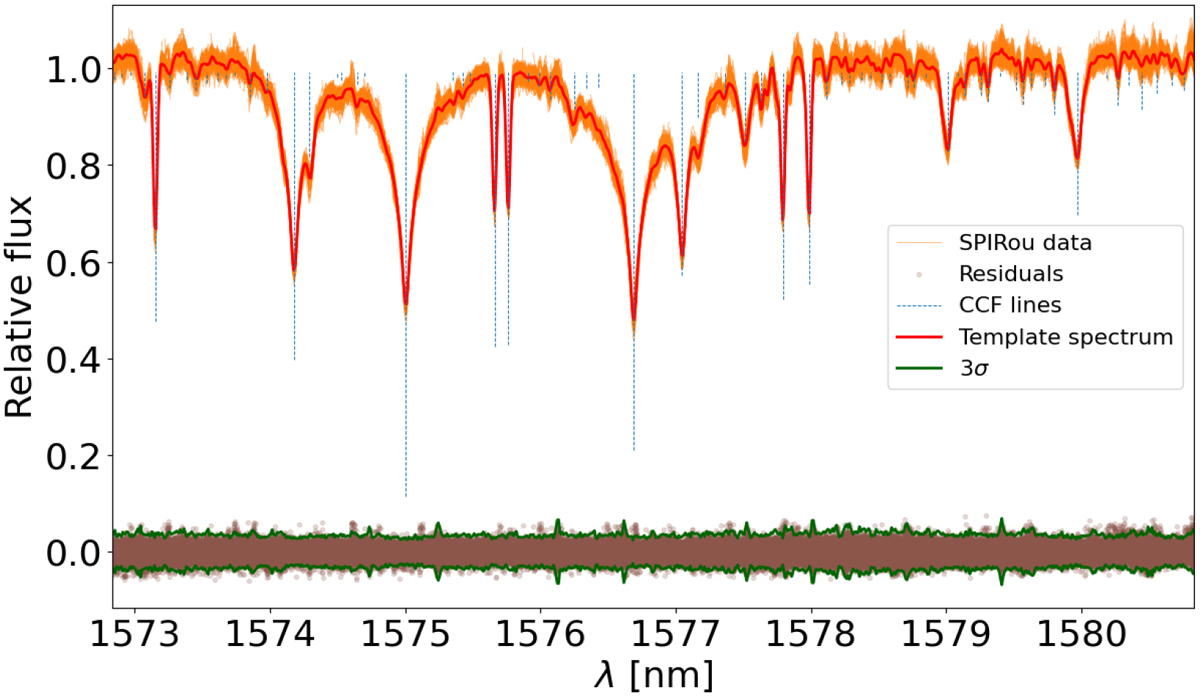
Example of the reduced SPIRou spectra of TOI-1759 in the CCF analysis. Orange lines show the normalized SPIRou spectra for a small range in the H band. The red line shows the template spectrum, and the brown points show the residuals. The green lines show the measured ±3σ dispersion of the residuals, which are used by the sigma-clipping algorithm to reject outliers. The dashed blue lines show the central wavelengths of the CCF lines in the star’s frame of reference, where the depth of these lines is proportional to the CCF weight.
Current usage metrics show cumulative count of Article Views (full-text article views including HTML views, PDF and ePub downloads, according to the available data) and Abstracts Views on Vision4Press platform.
Data correspond to usage on the plateform after 2015. The current usage metrics is available 48-96 hours after online publication and is updated daily on week days.
Initial download of the metrics may take a while.