Fig. D.3
Download original image
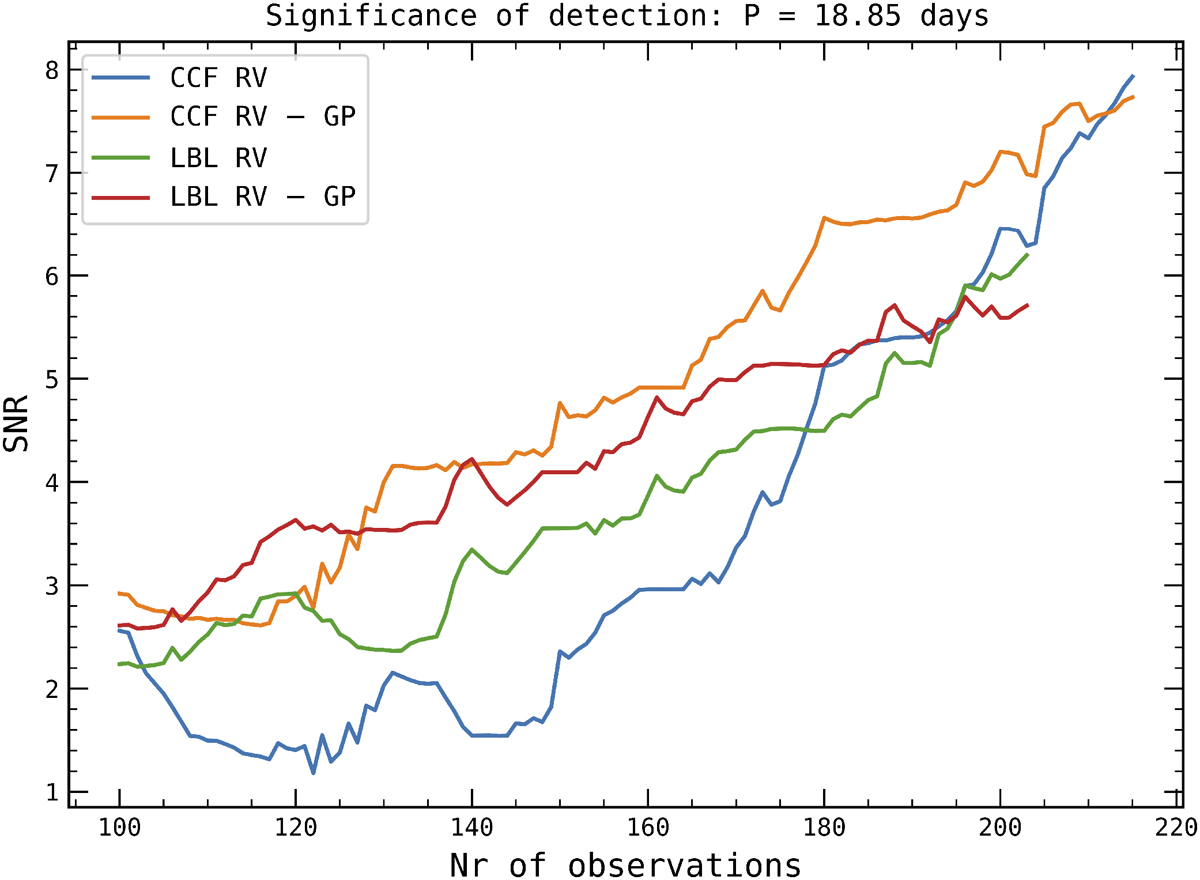
Significance of detection of the TOI-1759 b orbit RV signal at 18.85 d in the SBGLSP analysis. Each curve represents the S/N as a function of the number of observations. The S/N is calculated as the ratio between the SBGLSP power at 18.85 d and the noise in the periodogram. There is a monotonic increase in the S/N with the number of observations for all data sets, showing the coherent nature of the signal detected.
Current usage metrics show cumulative count of Article Views (full-text article views including HTML views, PDF and ePub downloads, according to the available data) and Abstracts Views on Vision4Press platform.
Data correspond to usage on the plateform after 2015. The current usage metrics is available 48-96 hours after online publication and is updated daily on week days.
Initial download of the metrics may take a while.