Open Access
Fig. D.2
Download original image
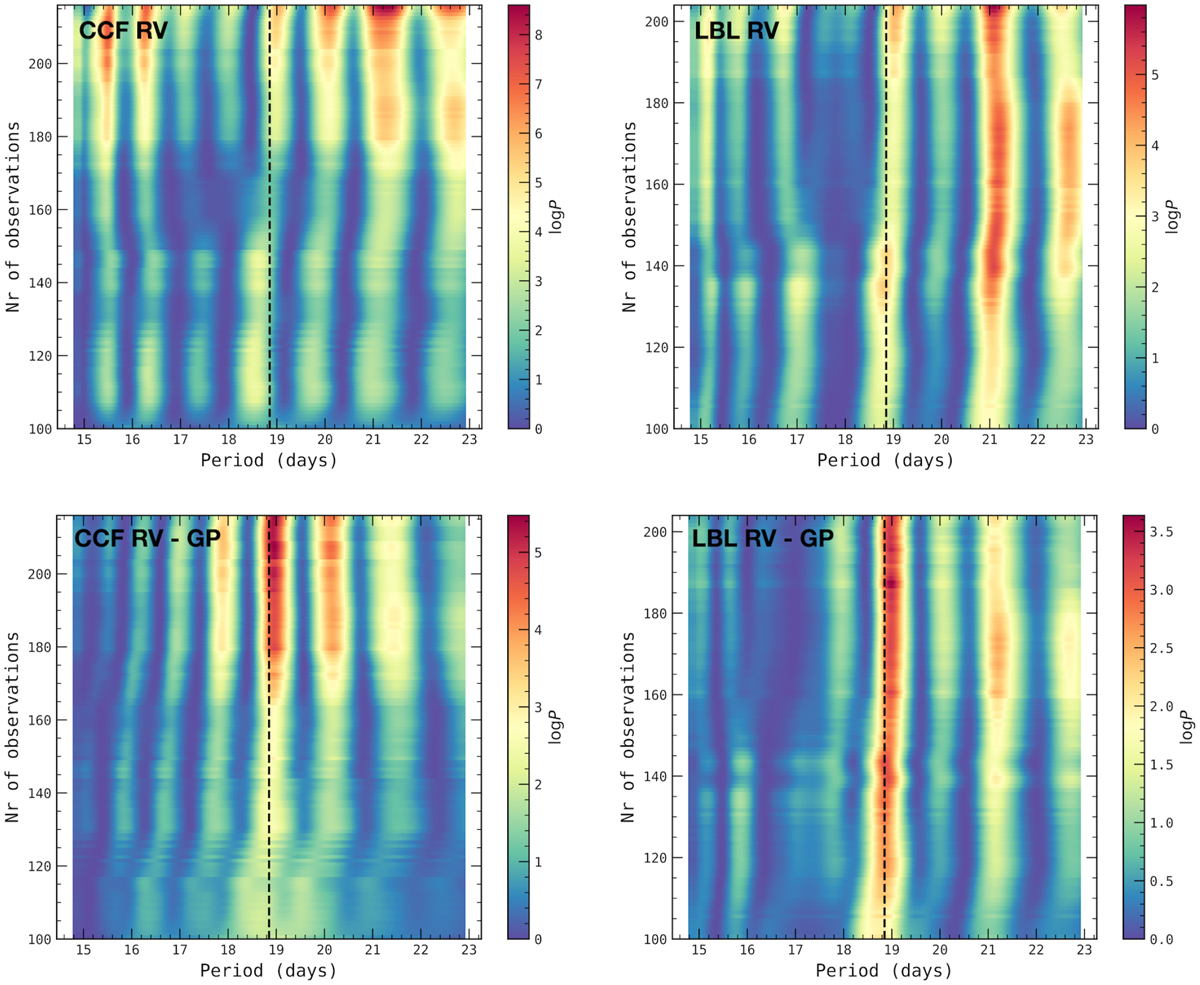
SBGLSP analysis of the SPIRou RVs of TOI-1759. Each panel shows a color map of the power in the SBGLSP for each RV data set. The vertical dashed lines show the orbital period of TOI-1759 b.
Current usage metrics show cumulative count of Article Views (full-text article views including HTML views, PDF and ePub downloads, according to the available data) and Abstracts Views on Vision4Press platform.
Data correspond to usage on the plateform after 2015. The current usage metrics is available 48-96 hours after online publication and is updated daily on week days.
Initial download of the metrics may take a while.