Fig. C.1
Download original image
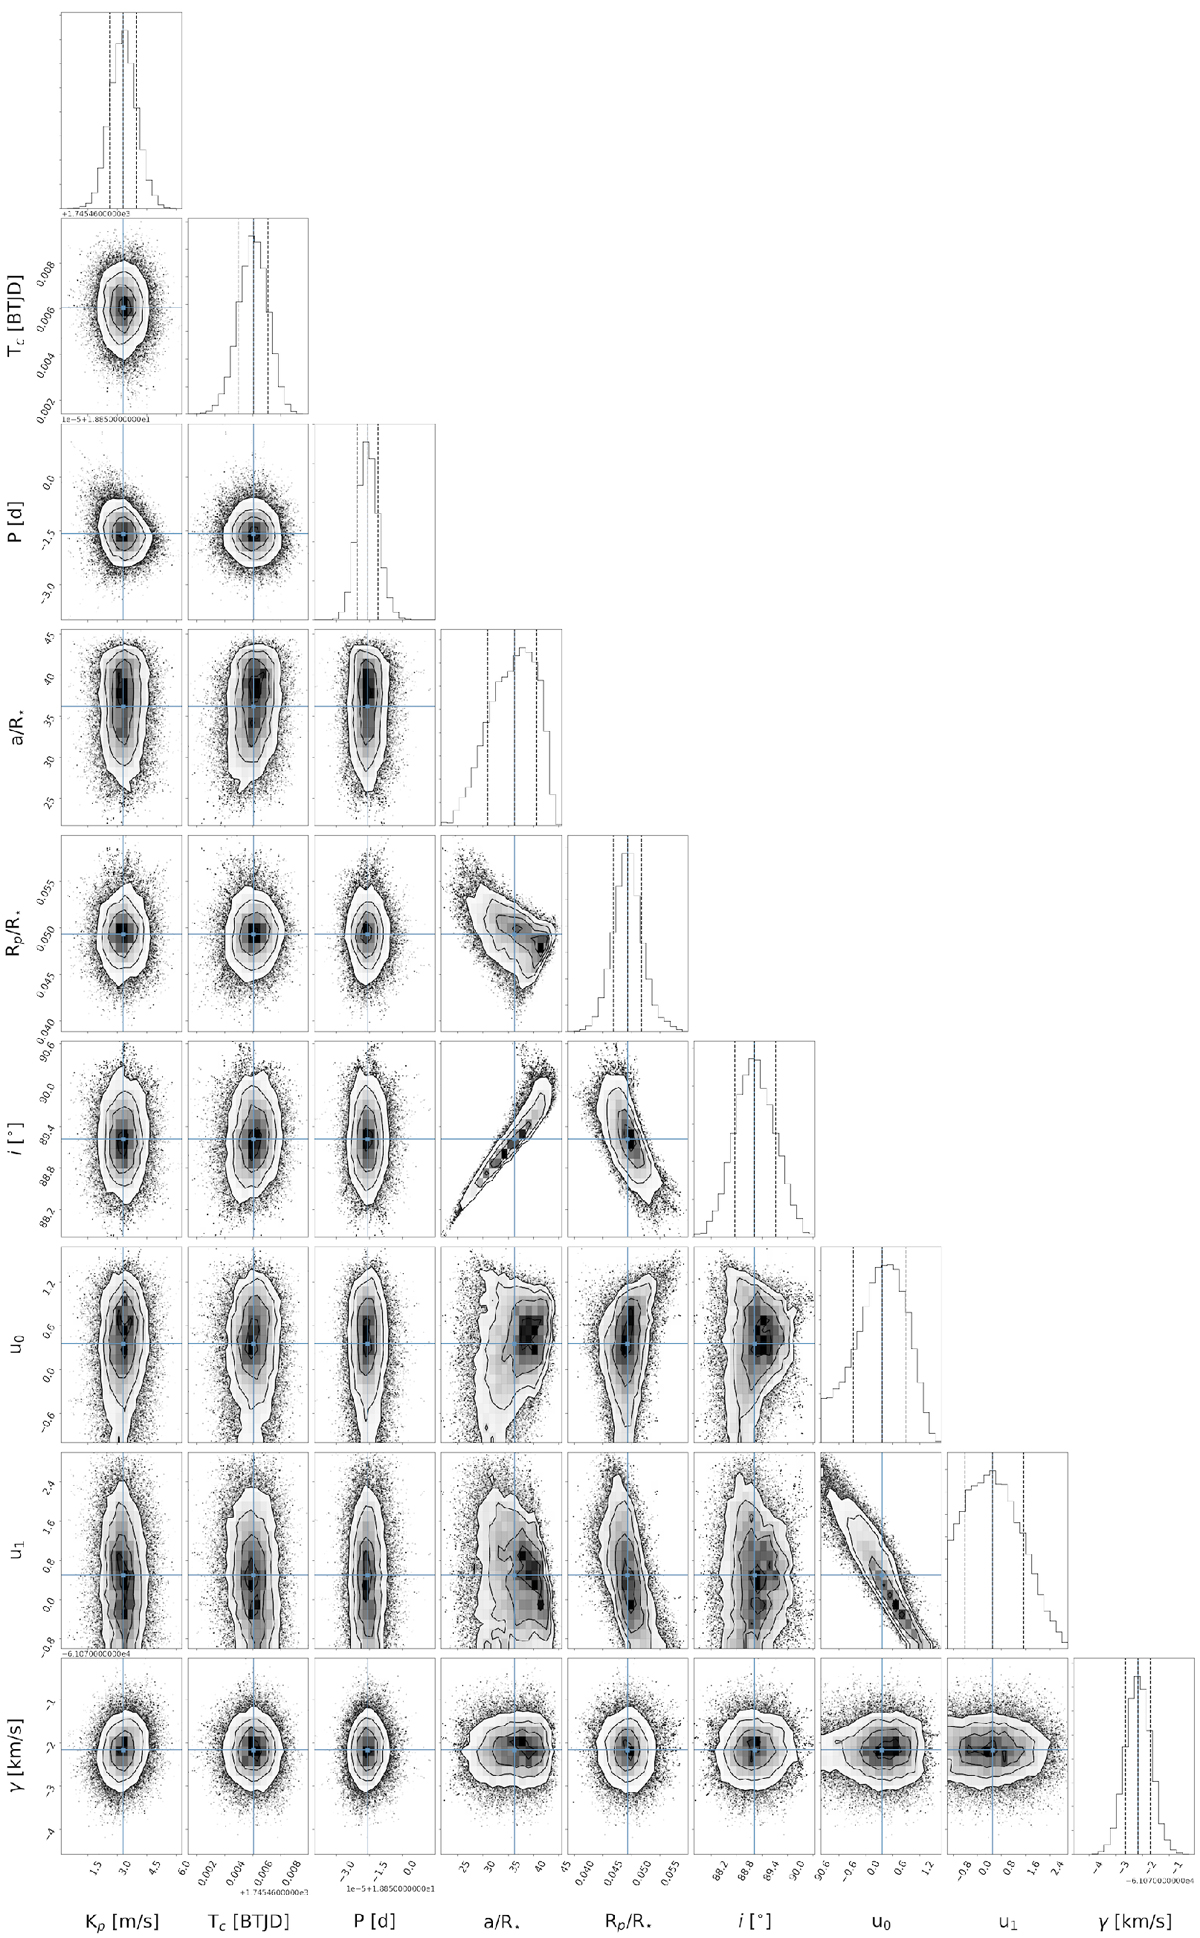
Pairs plot showing the MCMC samples and posterior distributions of the free parameters in our joint analysis of the TESS photometry and the SPIRou CCF RV data. The contours mark the 1σ, 2σ, and 3σ regions of the distribution. The blue crosses indicate the best-fit values for each parameter and the dashed vertical lines in the projected distributions show the median values and the 1σ uncertainty (34% on each side of the median).
Current usage metrics show cumulative count of Article Views (full-text article views including HTML views, PDF and ePub downloads, according to the available data) and Abstracts Views on Vision4Press platform.
Data correspond to usage on the plateform after 2015. The current usage metrics is available 48-96 hours after online publication and is updated daily on week days.
Initial download of the metrics may take a while.