Fig. B.1
Download original image
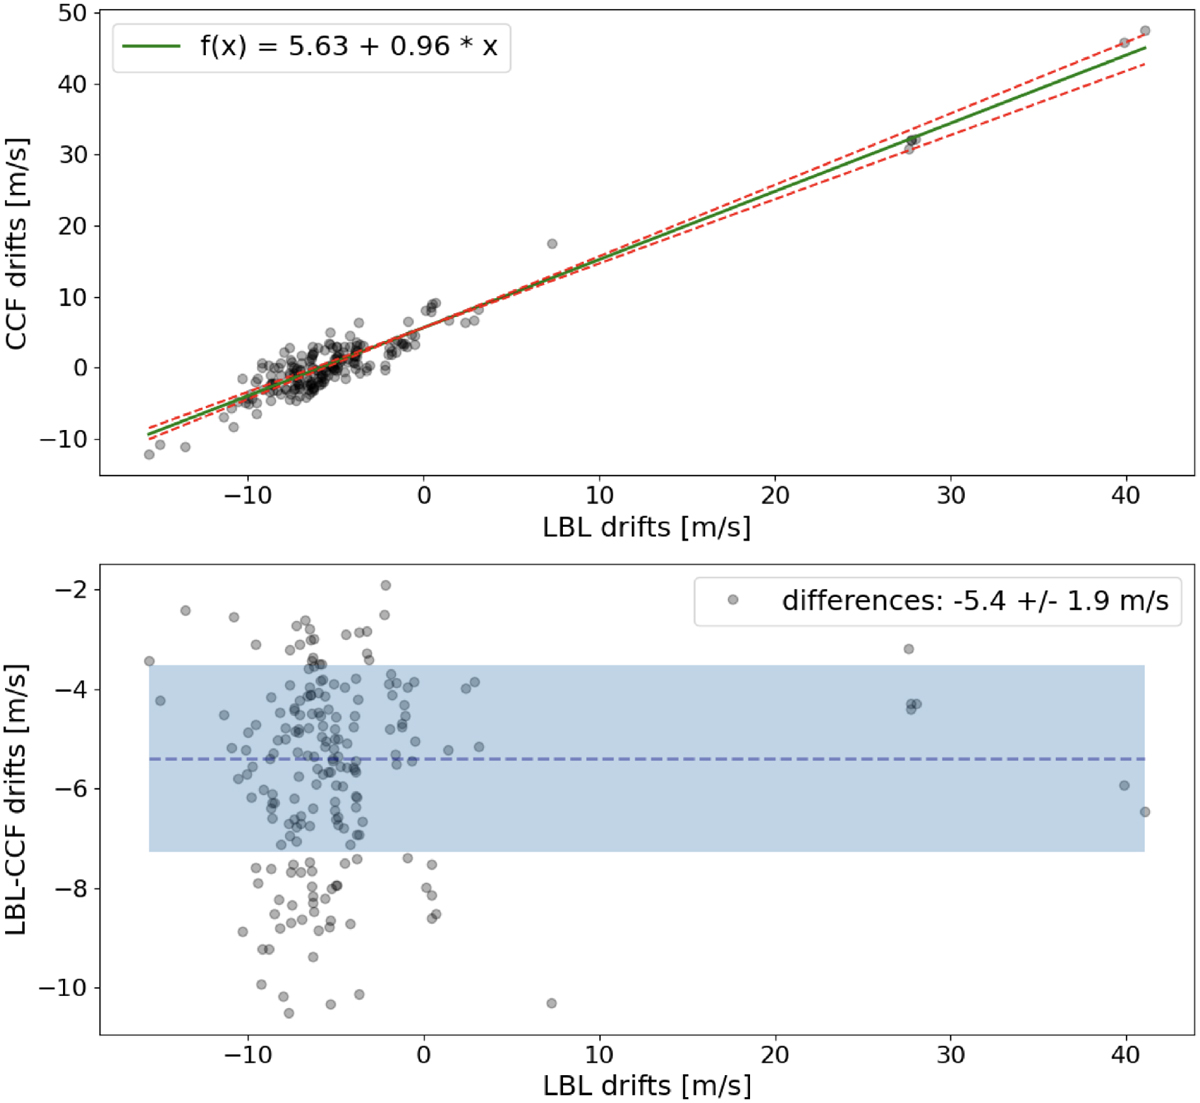
Comparison between CCF and LBL RV drifts measured from the Fabry-Pérot spectra obtained by the simultaneous calibration fiber of SPIRou observations of TOI-1759. The top panel shows the CCF drifts versus LBL drifts (black circles) as well as a linear fit to these quantities (solid green line) and its 1σ uncertainties (dashed red lines). The linear fit (parameters presented in the legend) shows a correlation of 0.96 between the CCF and LBL drifts. The bottom panel shows the differences between LBL and CCF drifts (black circles), the median (dashed blue line), and the 1σ = 1.9 ms−1 dispersion (shaded blue region).
Current usage metrics show cumulative count of Article Views (full-text article views including HTML views, PDF and ePub downloads, according to the available data) and Abstracts Views on Vision4Press platform.
Data correspond to usage on the plateform after 2015. The current usage metrics is available 48-96 hours after online publication and is updated daily on week days.
Initial download of the metrics may take a while.