Fig. 2
Download original image
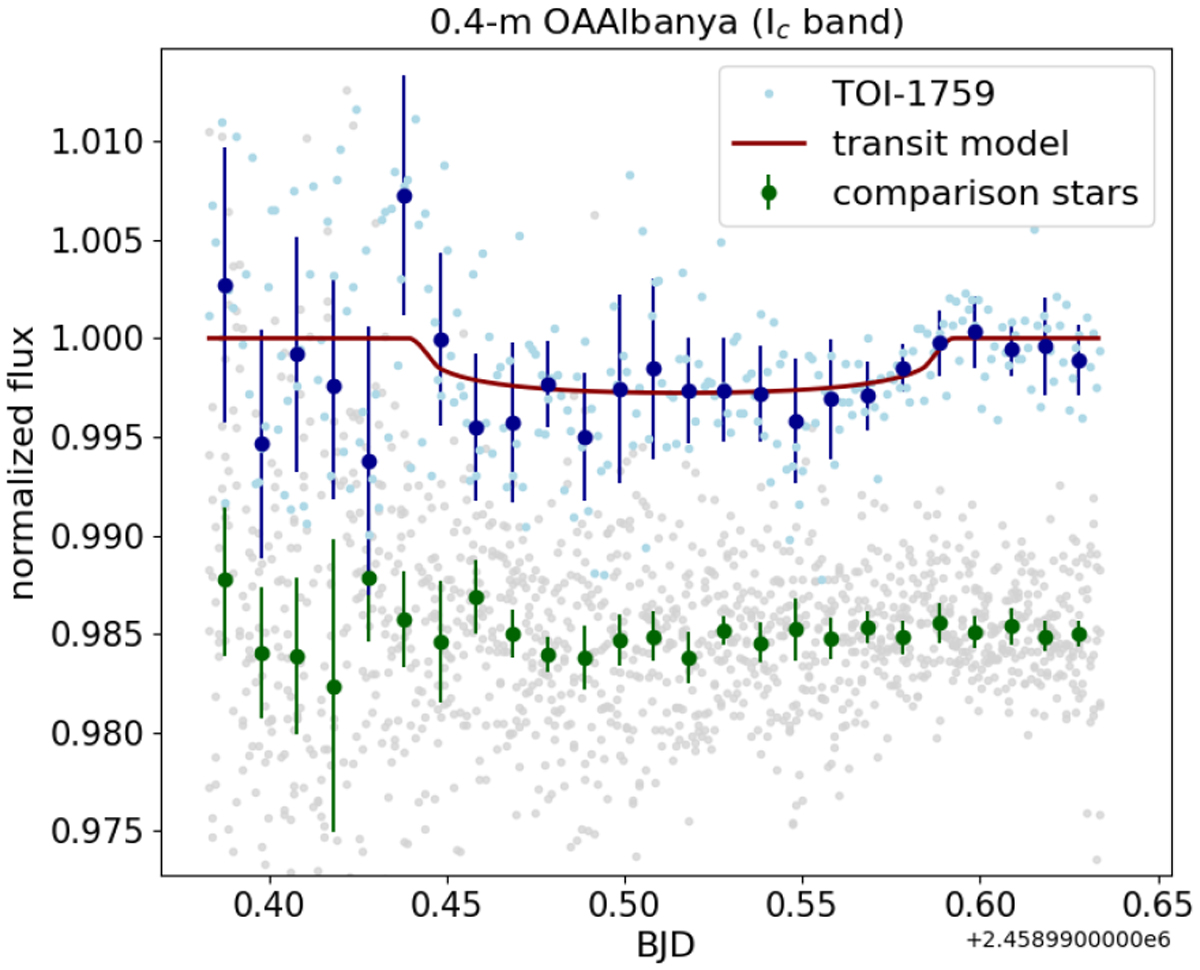
Ground-based Ic -band differential photometry time series of a transit of TOI-1759 b obtained by the 0.4 m OAAlbanya observatory on May 20, 2020. The light blue points show relative fluxes of TOI-1759, and the dark blue points show weighted average bins with bin sizes of 0.01 days. The gray and green points show the relative fluxes for the comparison stars that we used in the differential photometry. The red line shows the best-fit transit model obtained from our analysis of the TESS data alone, as presented in Sect. 5.
Current usage metrics show cumulative count of Article Views (full-text article views including HTML views, PDF and ePub downloads, according to the available data) and Abstracts Views on Vision4Press platform.
Data correspond to usage on the plateform after 2015. The current usage metrics is available 48-96 hours after online publication and is updated daily on week days.
Initial download of the metrics may take a while.