Fig. 16
Download original image
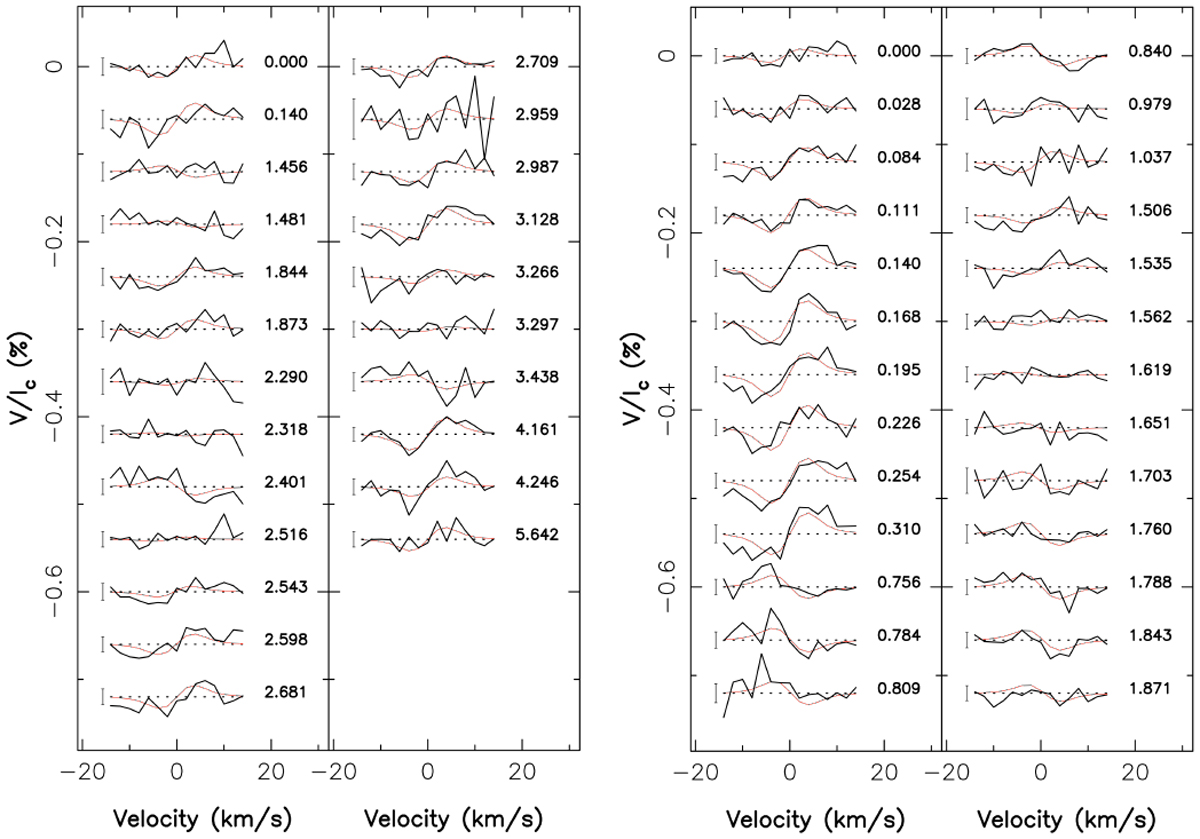
Stokes V profiles (black lines) and their model (red lines) obtained with Prot = 35.7 d, veq sin (i)=0.84 km s−1 and i = 80 deg. The numbers at the right of each profile indicate the rotational cycle relative to the first Julian date of the time series of each season. The profiles are shifted vertically for better visualization. Left: 2020 time series. Right: 2021 time series.
Current usage metrics show cumulative count of Article Views (full-text article views including HTML views, PDF and ePub downloads, according to the available data) and Abstracts Views on Vision4Press platform.
Data correspond to usage on the plateform after 2015. The current usage metrics is available 48-96 hours after online publication and is updated daily on week days.
Initial download of the metrics may take a while.