Fig. 15
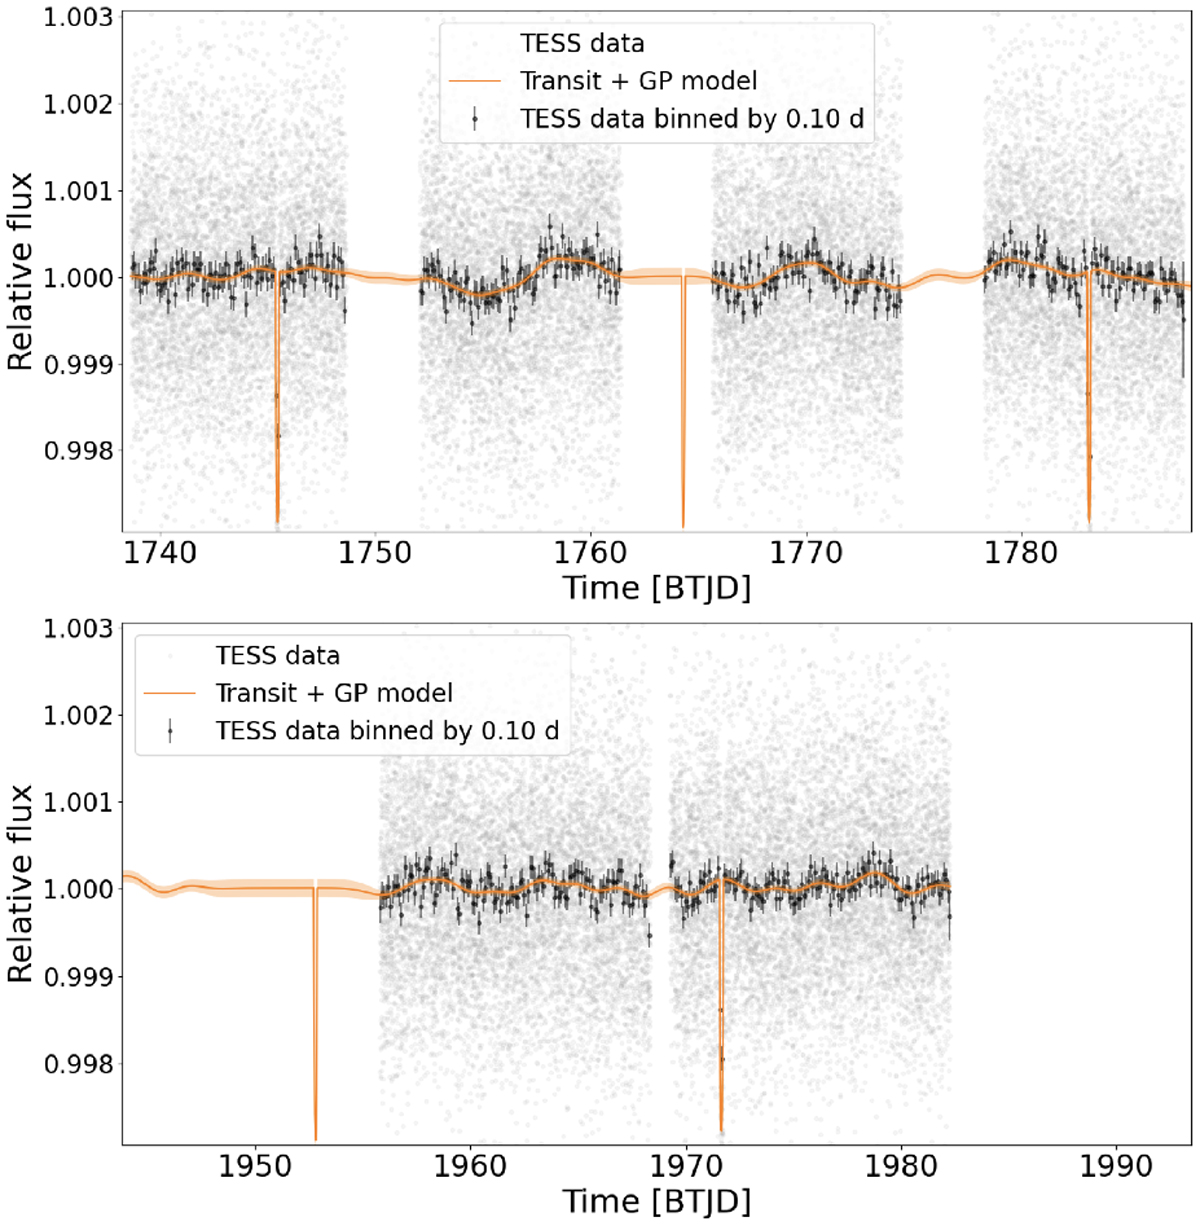
Download original image
GP analysis of the TESS photometry time series. The top panel shows the TESS data obtained in Sectors 16 and 17, and the bottom panel shows the data obtained in Sector 24. Black hollow circles show the TESS photometry in its original sampling, and the black points show the binned data, where each bin is calculated by the weighted mean within windows of 0.1 day. The orange line and shaded region show the best-fit GP model (multiplied by the transit model) and its uncertainty.
Current usage metrics show cumulative count of Article Views (full-text article views including HTML views, PDF and ePub downloads, according to the available data) and Abstracts Views on Vision4Press platform.
Data correspond to usage on the plateform after 2015. The current usage metrics is available 48-96 hours after online publication and is updated daily on week days.
Initial download of the metrics may take a while.