Fig. 14

Download original image
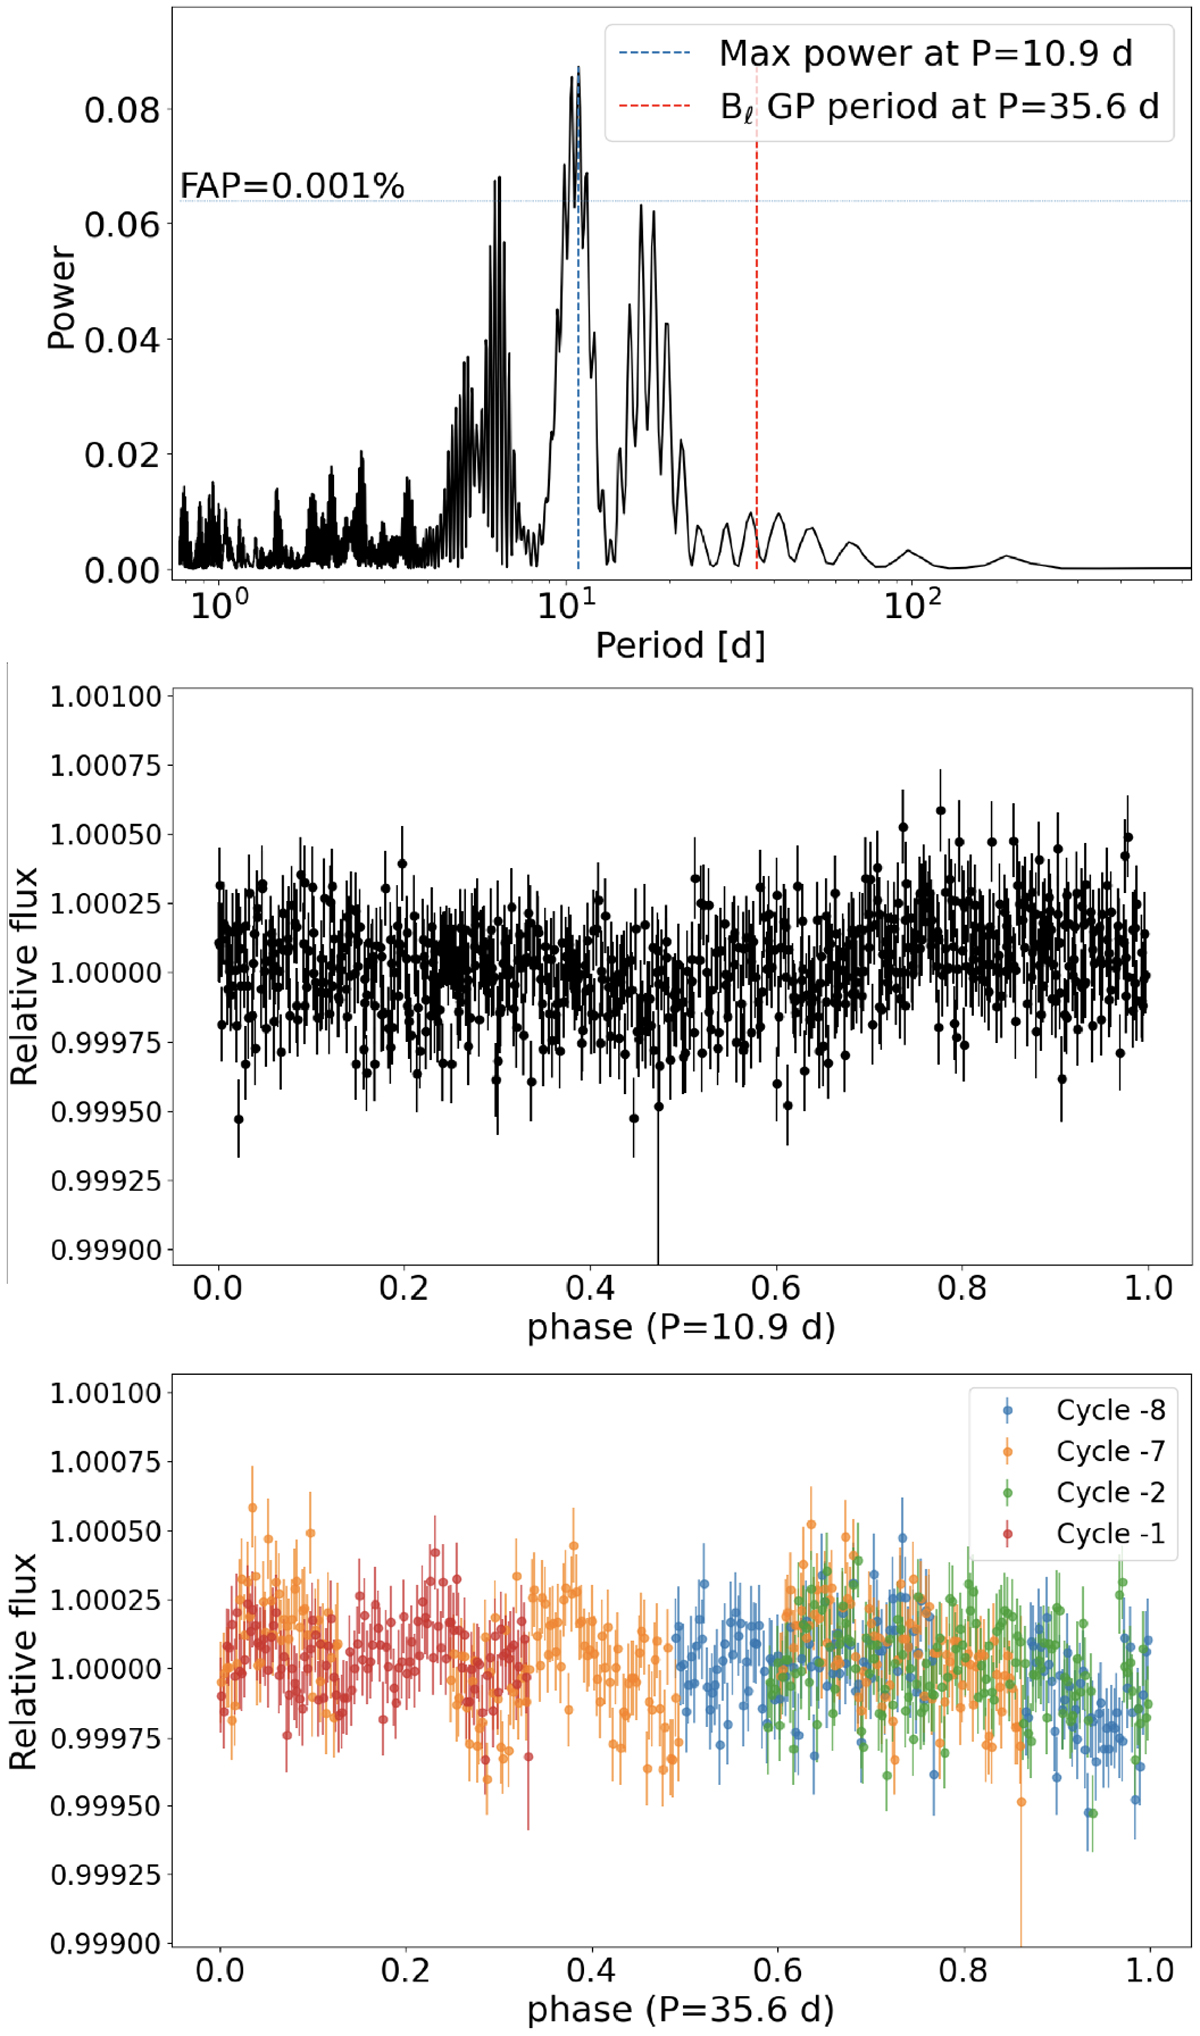
GLS periodogram analysis of the TESS photometry data, with the best-fit transit model subtracted and binned by weighted average with a bin size of 0.1 days. The top panel shows the GLS periodogram, where the maximum power at 10.9 days is marked by the dashed blue line. The dashed red line shows the best-fit star rotation period of 35.7 days obtained in our analysis of the Bℓ data. The middle panel shows the TESS data phase-folded with a period of 10.9 days, and the bottom panel shows the TESS data phase-folded with a period of 35.7 days. The latter shows the data represented by a different color for each rotation cycle (as in Fig. 13), with the time of the zeroth cycle considered to be the time of the first SPIRou observation, that is, 2459006.063741 BJD.
Current usage metrics show cumulative count of Article Views (full-text article views including HTML views, PDF and ePub downloads, according to the available data) and Abstracts Views on Vision4Press platform.
Data correspond to usage on the plateform after 2015. The current usage metrics is available 48-96 hours after online publication and is updated daily on week days.
Initial download of the metrics may take a while.


