Fig. 10
Download original image
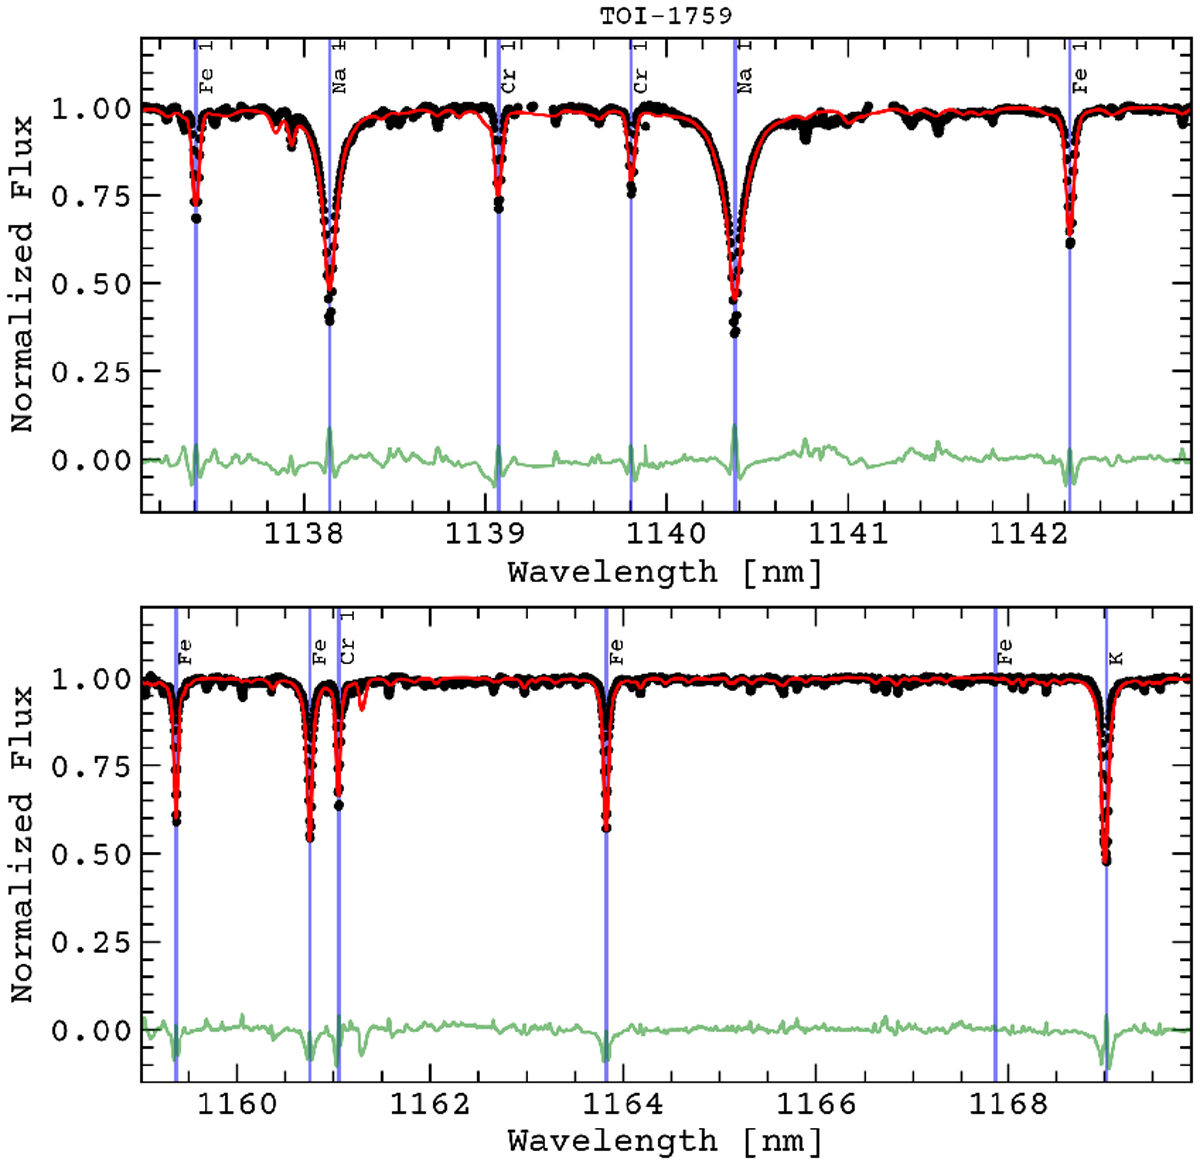
Spectral synthesis analysis of TOI-1759. Black points show the normalized template SPIRou spectrum of TOI-1759, and the red line shows the best-fit synthetic spectrum with Teff = 4036 ± 100 K, log g = 5.1 ± 0.6 dex, and [M/H] = +0.2 ± 0.3 dex. The vertical blue lines show the positions of the lines of the main chemical species (as indicated on the labels) considered in our analysis. Our analysis included a total of 10242 lines within the spectral range 1137–1169 nm. Solid green lines show the residuals (observed minus synthetic).
Current usage metrics show cumulative count of Article Views (full-text article views including HTML views, PDF and ePub downloads, according to the available data) and Abstracts Views on Vision4Press platform.
Data correspond to usage on the plateform after 2015. The current usage metrics is available 48-96 hours after online publication and is updated daily on week days.
Initial download of the metrics may take a while.