Free Access
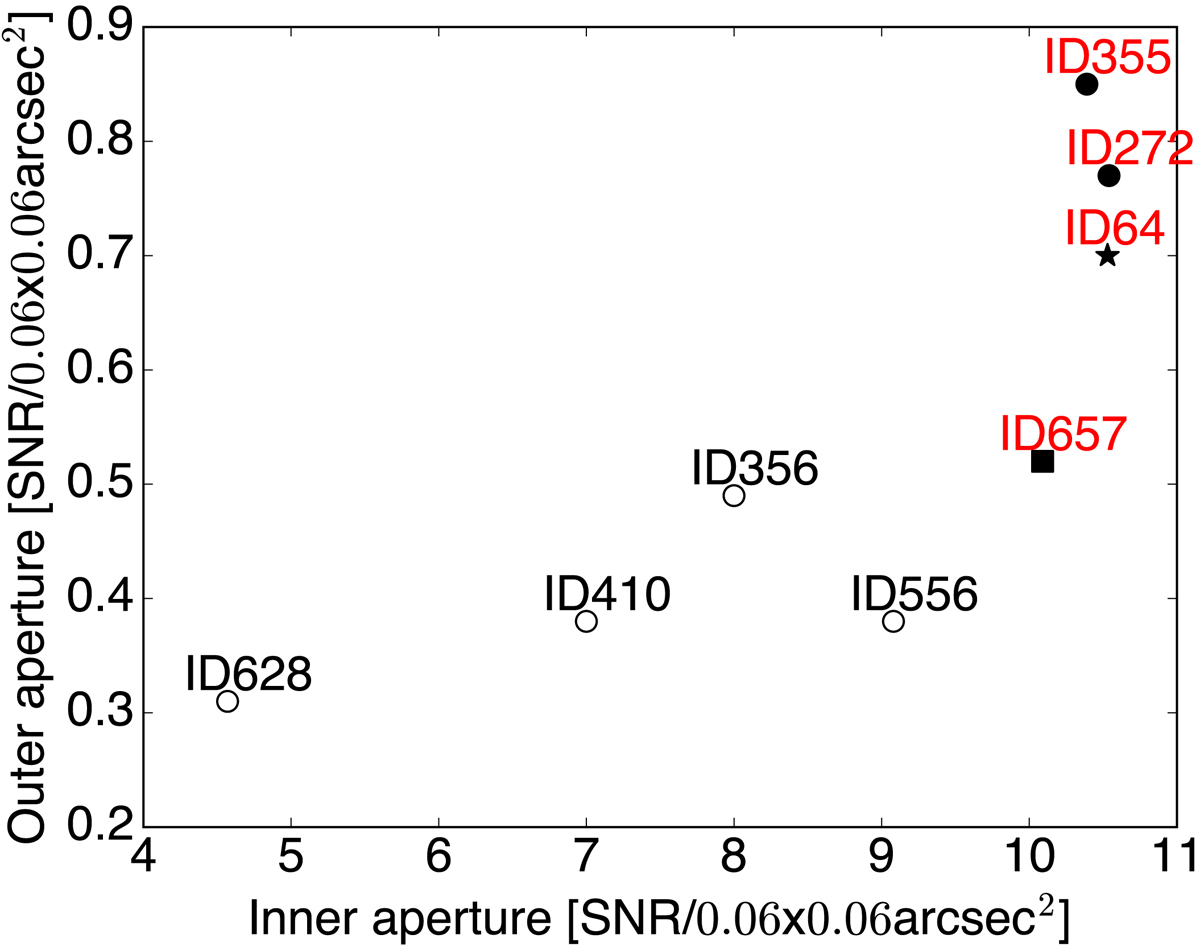
Fig. 4.
Download original image
F160W S/N of the inner and outer zones. The filled symbols indicate the galaxies described in the text. S/Ns are given for a single imaging pixel (0.06 × 0.06 arcsec2), but they were calculated as the average S/N over larger areas (∼10 for the inner zone, and ∼400 for the outer zone).
Current usage metrics show cumulative count of Article Views (full-text article views including HTML views, PDF and ePub downloads, according to the available data) and Abstracts Views on Vision4Press platform.
Data correspond to usage on the plateform after 2015. The current usage metrics is available 48-96 hours after online publication and is updated daily on week days.
Initial download of the metrics may take a while.