Fig. 7.
Download original image
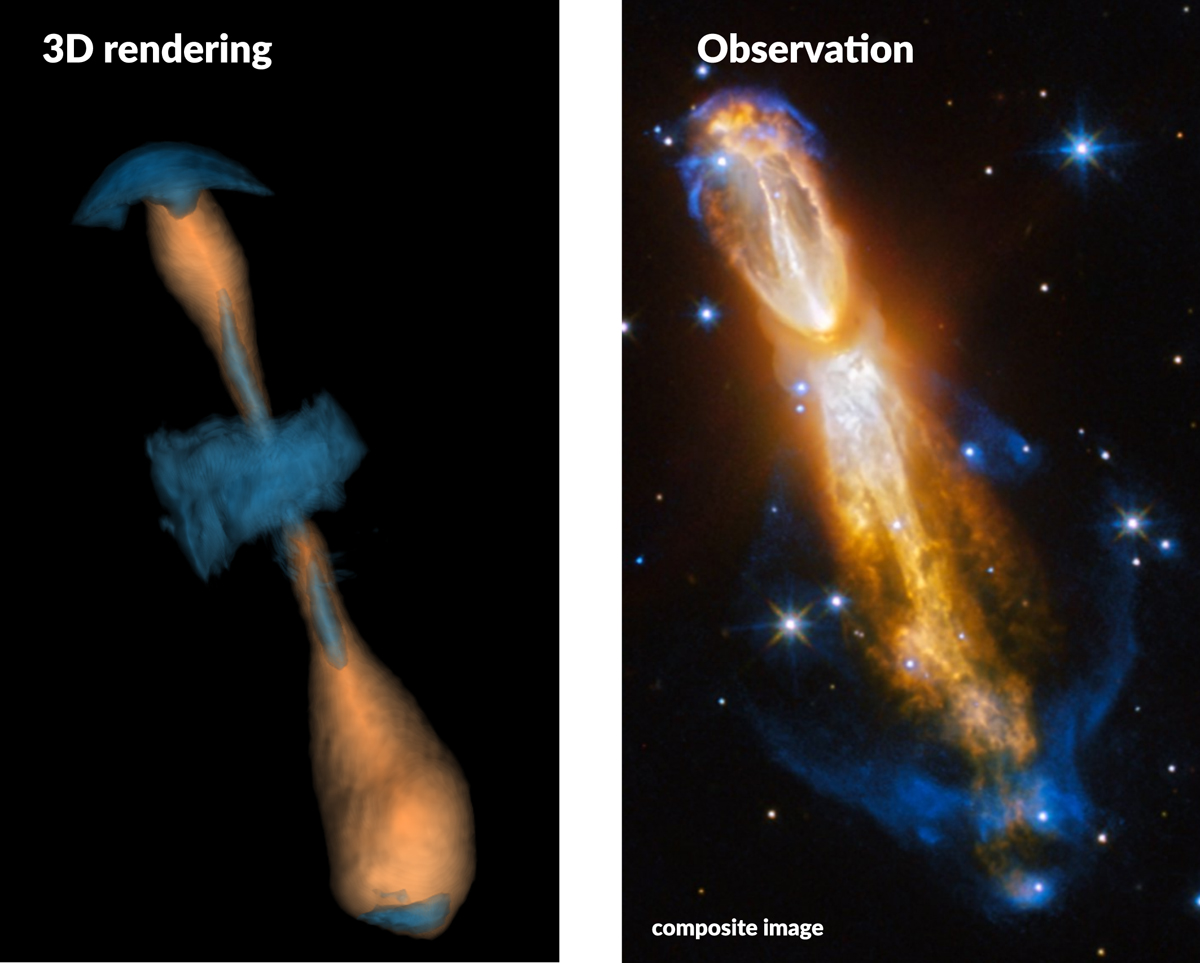
Qualitative morphological comparison between the simulated outflow and observations of the Calabash Nebula (OH 231.84 +4.22). Left panel: geometry of the outflow represented by radial velocity (orange) and temperature (blue). Right panel: composite, optical image taken by the NASA/ESA Hubble Space Telescope. We note that the rendering of our simulation is not to scale with the observation.
Current usage metrics show cumulative count of Article Views (full-text article views including HTML views, PDF and ePub downloads, according to the available data) and Abstracts Views on Vision4Press platform.
Data correspond to usage on the plateform after 2015. The current usage metrics is available 48-96 hours after online publication and is updated daily on week days.
Initial download of the metrics may take a while.