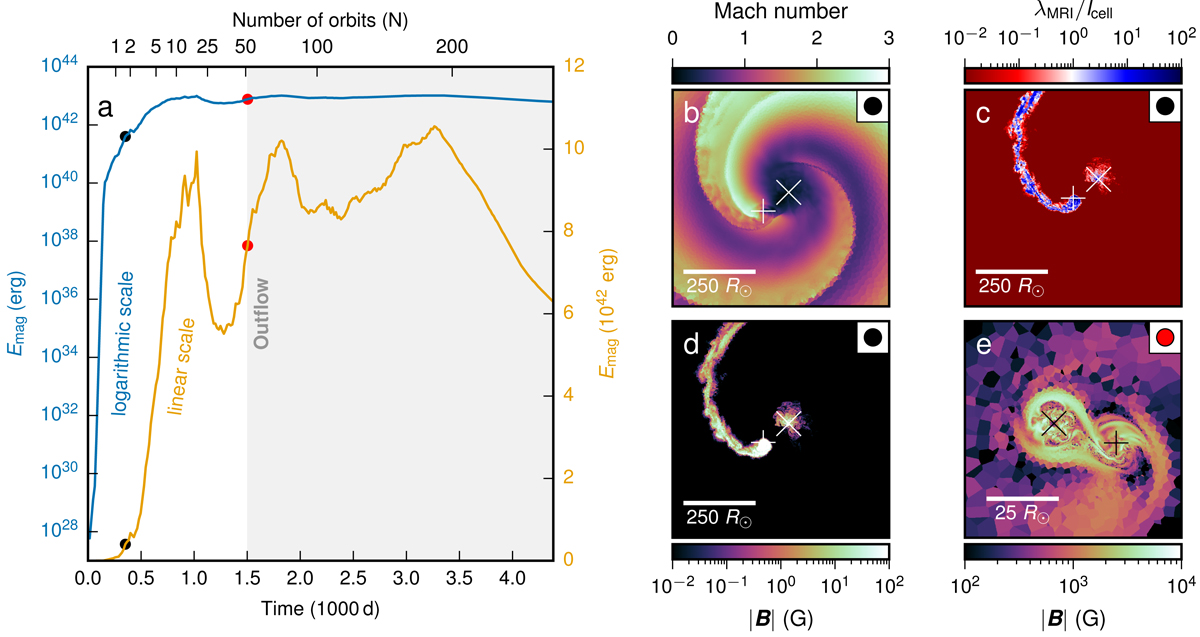
Fig. 4.
Download original image
Amplification of magnetic fields. In panel a, the total magnetic energy is shown as a function of time on a logarithmic scale (blue) and on a linear scale (orange). Panels b, c, d, e: the sonic Mach number, the ratio of the wavelength of the fastest growing MRI mode and the AREPO cell size (λMRI/lcell), and the absolute magnetic-field strength (|B|) in the orbital plane, respectively. They provide details of the two episodes of field amplification: at t = 352 d, marked with black dots, and at t = 1504 d, indicated with red dots.
Current usage metrics show cumulative count of Article Views (full-text article views including HTML views, PDF and ePub downloads, according to the available data) and Abstracts Views on Vision4Press platform.
Data correspond to usage on the plateform after 2015. The current usage metrics is available 48-96 hours after online publication and is updated daily on week days.
Initial download of the metrics may take a while.